> ## Documentation Index
> Fetch the complete documentation index at: https://statsig-4b2ff144-serverless-cloudflare.mintlify.site/llms.txt
> Use this file to discover all available pages before exploring further.
# Create an Experiment
> Learn how to create and configure a new experiment in the Statsig console, including scorecard setup and allocation targeting.
Metrics and experiments behave differently in Warehouse Native. Read about [Configuring Experiments in Warehouse Native](/statsig-warehouse-native/features/experiment-options).
This doc walks through the steps of creating a new experiment in the Statsig console. If you're looking for an end-to-end guide that includes integrating the Statsig SDK, see [Run your first experiment](/guides/abn-tests).
### User-level Experiments
To create a user-level experiment, follow these steps:
1. Log into the Statsig console at [https://console.statsig.com/](https://console.statsig.com/)
2. Navigate to **Experiments** in the left-hand navigation panel
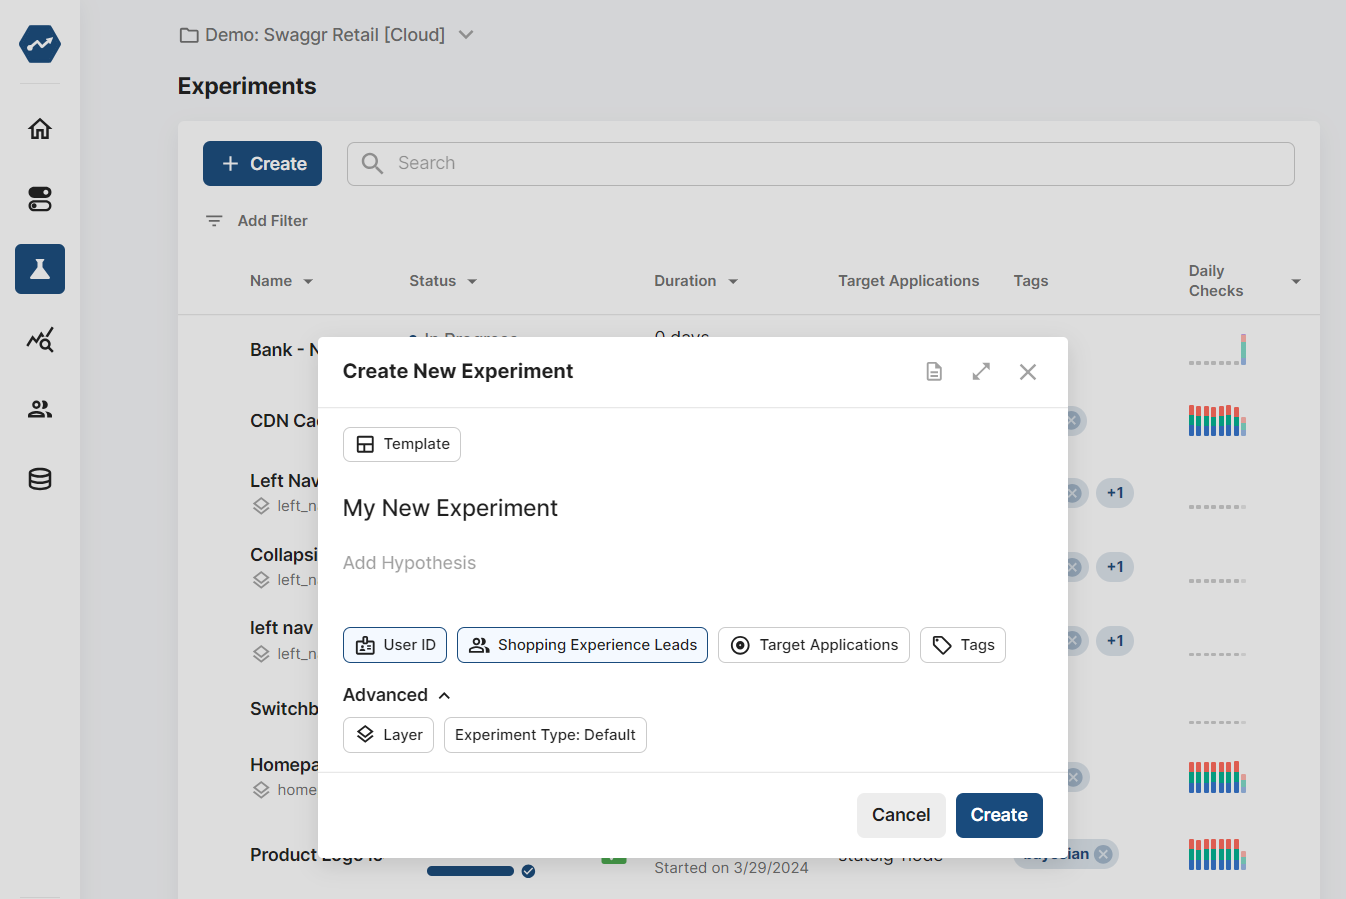
3. Click on the **Create** button
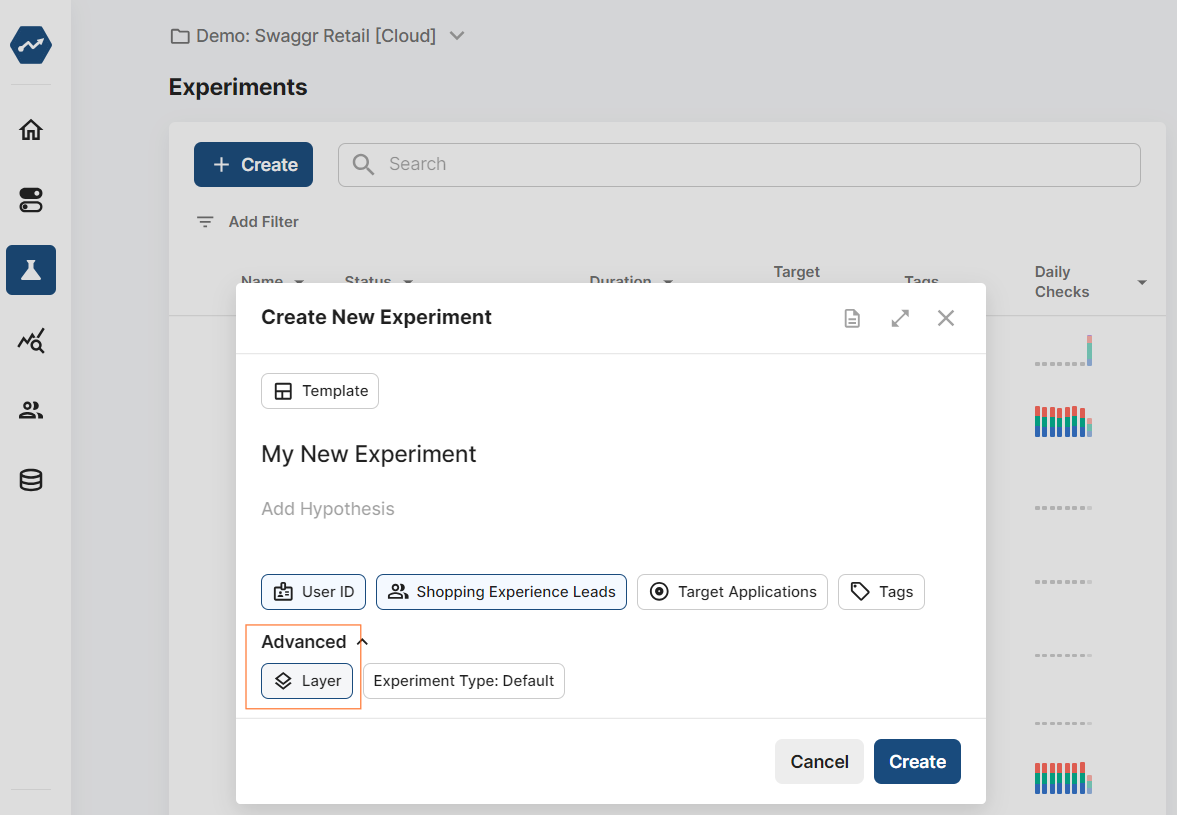
4. Enter the name and description for your experiment as shown in the figure below
5. By default, your experiment runs in its own **Layer**. A Layer allows you to manage multiple experiments and feature flags together. If you want to add this experiment to an existing Layer, select **Add Layer** under **Advanced** in the experiment creation modal. You can also create a new Layer by selecting **Create New Layer**.
6. Click **Create**
 ### Configure Your Scorecard
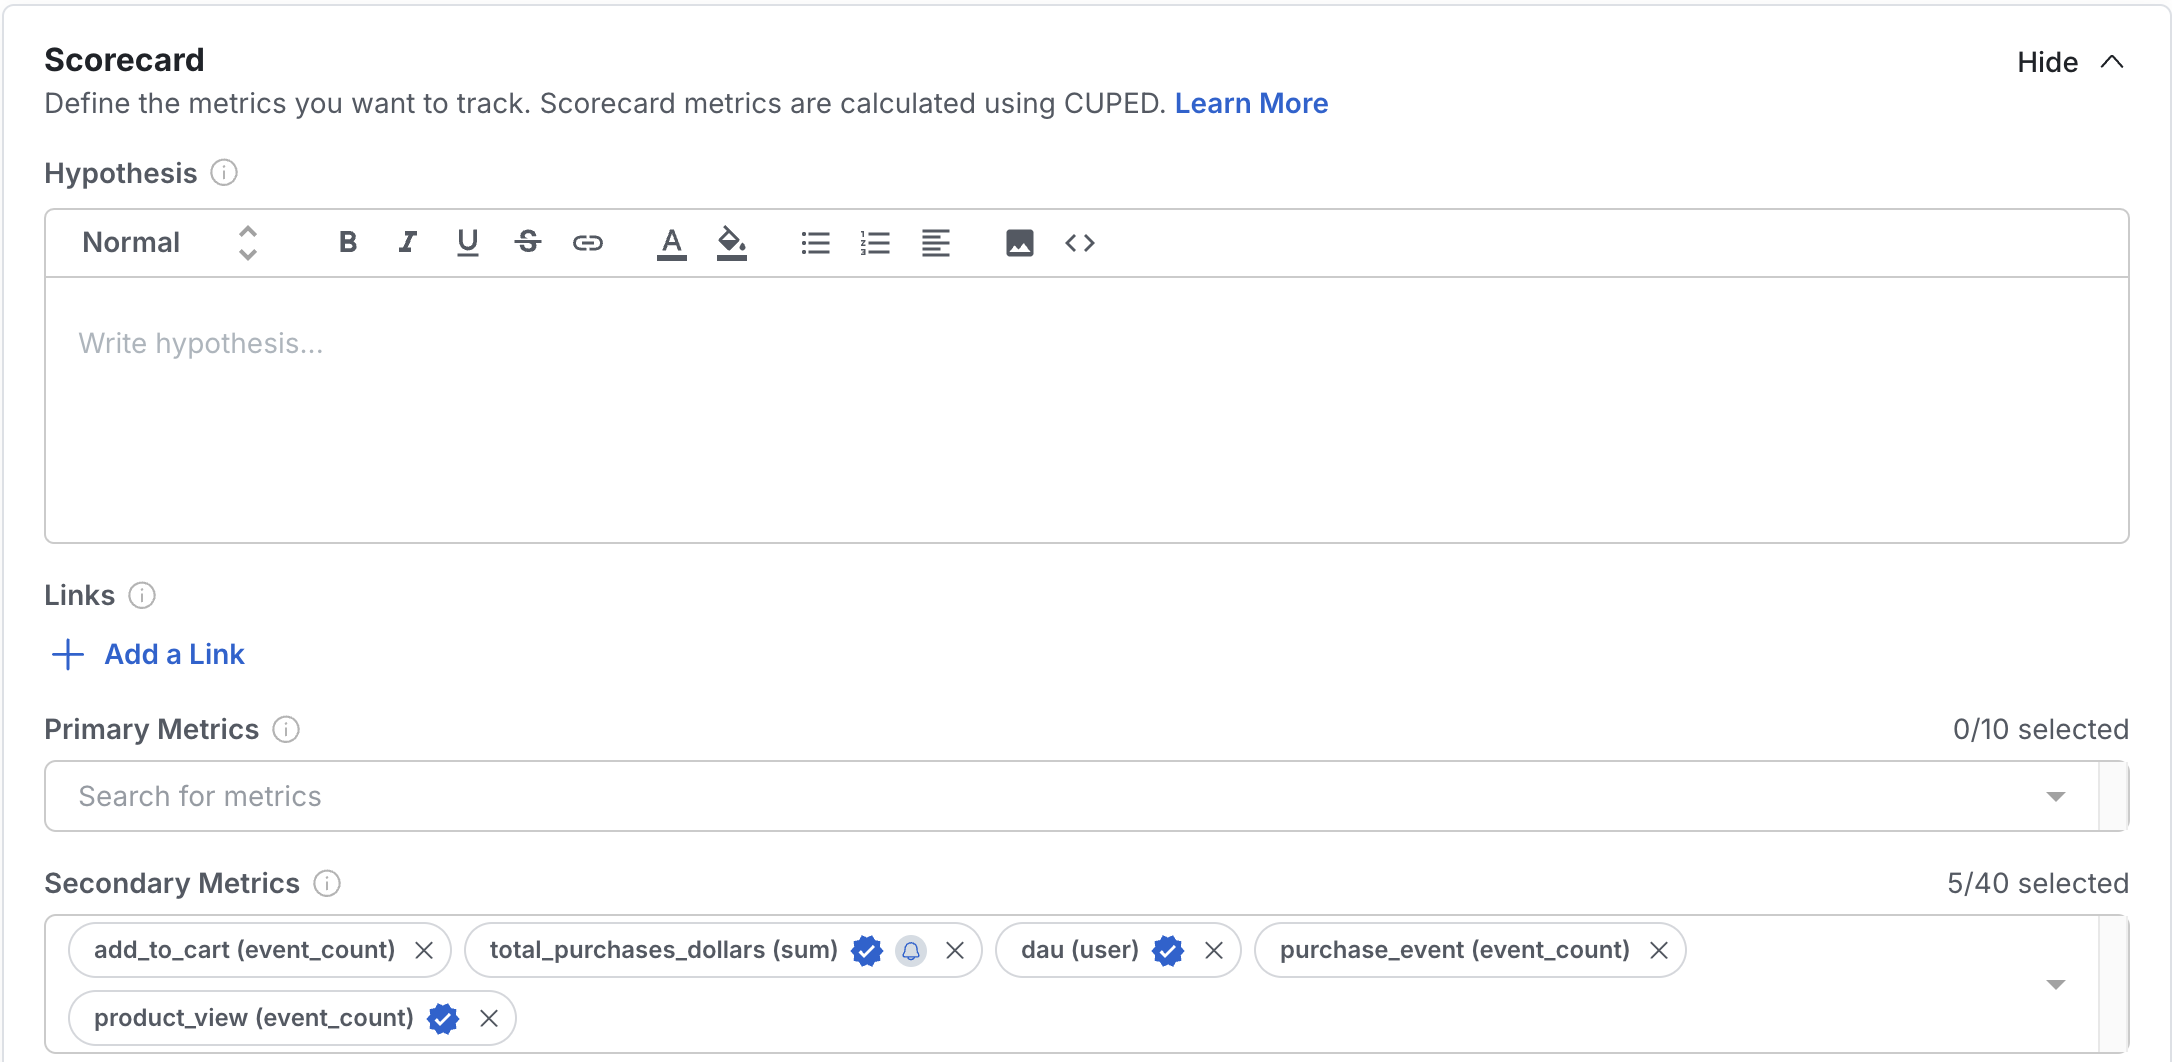
When running an experiment, it’s common to test a specific hypothesis using a set of key metrics. The **Scorecard** feature makes this easy by letting you enter your hypothesis and select both primary and secondary metrics.
* **Primary Metrics** are those you expect to be directly impacted by the experiment.
* **Secondary Metrics** are important to monitor to ensure there are no unintended side effects, but they aren’t the primary focus of your experiment.
Configuring the Scorecard is a required step when creating an experiment. It provides your team with clear context on what is being tested and how success is measured. You must enter your hypothesis and select at least one primary metric. Metrics added to the Scorecard are computed daily and eligible for advanced treatments like [CUPED](/experiments/statistical-methods/methodologies/cuped) and [Sequential Testing](/experiments/advanced-setup/sequential-testing).
For best practices on configuring your Scorecard, read more [here](/experiments/interpreting-results/read-pulse).
### Configure Your Scorecard
When running an experiment, it’s common to test a specific hypothesis using a set of key metrics. The **Scorecard** feature makes this easy by letting you enter your hypothesis and select both primary and secondary metrics.
* **Primary Metrics** are those you expect to be directly impacted by the experiment.
* **Secondary Metrics** are important to monitor to ensure there are no unintended side effects, but they aren’t the primary focus of your experiment.
Configuring the Scorecard is a required step when creating an experiment. It provides your team with clear context on what is being tested and how success is measured. You must enter your hypothesis and select at least one primary metric. Metrics added to the Scorecard are computed daily and eligible for advanced treatments like [CUPED](/experiments/statistical-methods/methodologies/cuped) and [Sequential Testing](/experiments/advanced-setup/sequential-testing).
For best practices on configuring your Scorecard, read more [here](/experiments/interpreting-results/read-pulse).
 ### Configure Allocation and Targeting
This is where most of your experiment configuration happens.
#### Allocation
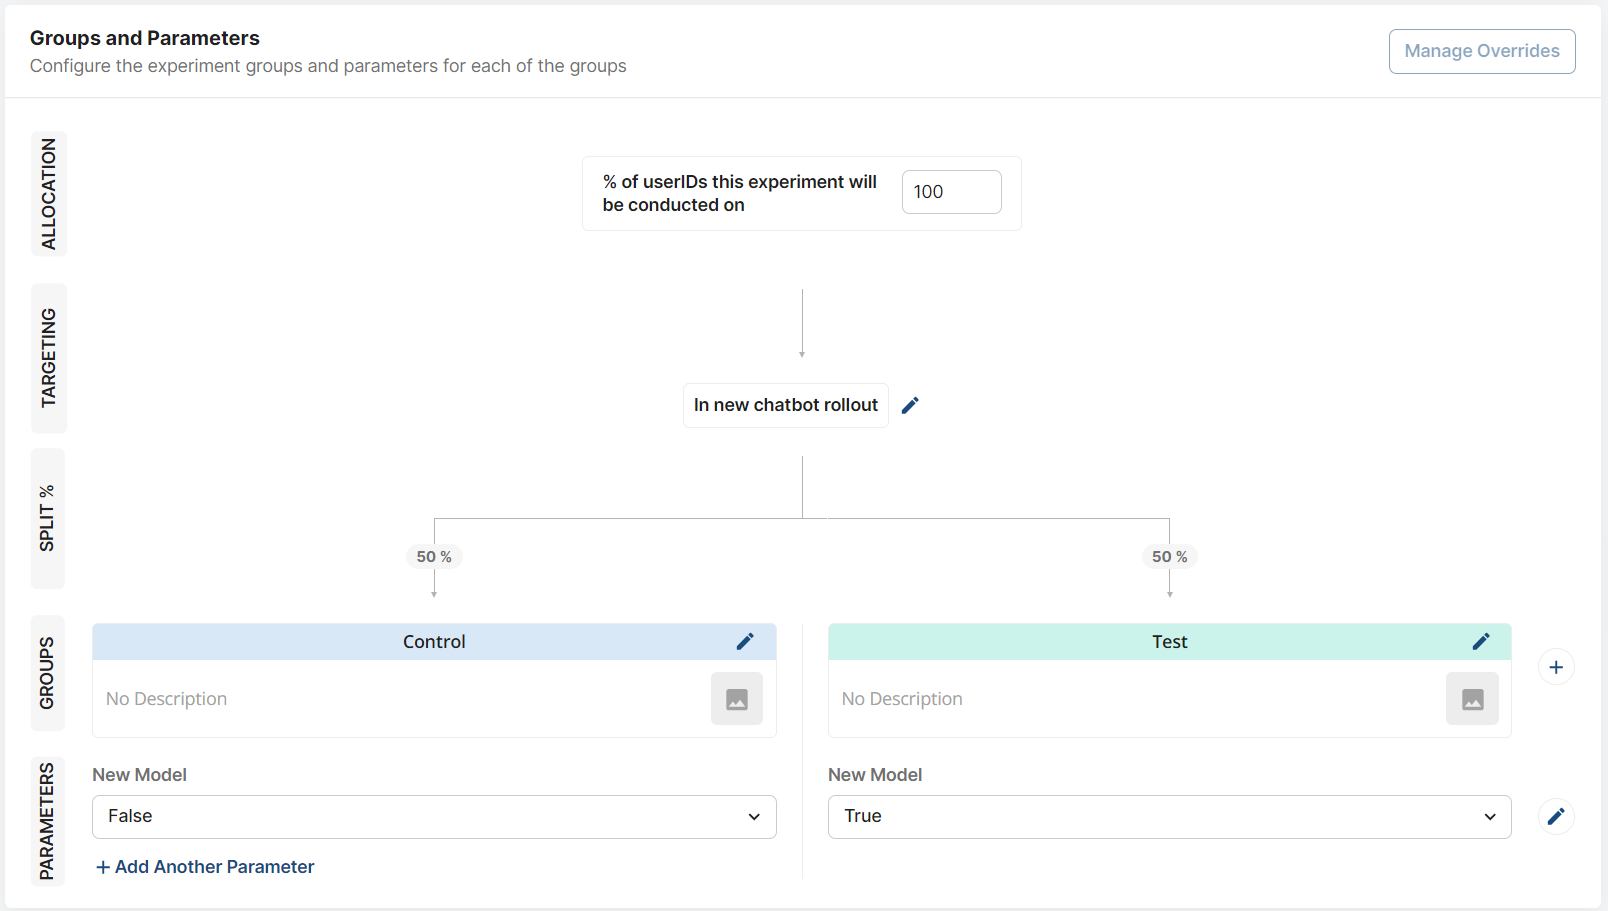
For **Allocation**, enter the percentage of users you want to assign to this experiment. You can allocate up to 100% of eligible users, but it’s good practice to start with a smaller percentage, verify the experiment’s stability, and then ramp up the allocation.
### Configure Allocation and Targeting
This is where most of your experiment configuration happens.
#### Allocation
For **Allocation**, enter the percentage of users you want to assign to this experiment. You can allocate up to 100% of eligible users, but it’s good practice to start with a smaller percentage, verify the experiment’s stability, and then ramp up the allocation.
 #### Targeting
To configure **Targeting** criteria, click to edit the **Targeting** section. You can either set new targeting criteria or use an existing **Feature Gate**. This will limit the experiment to only the users who meet the defined conditions.
#### Targeting
To configure **Targeting** criteria, click to edit the **Targeting** section. You can either set new targeting criteria or use an existing **Feature Gate**. This will limit the experiment to only the users who meet the defined conditions.
 * If your targeting is straightforward, creating it through Inline Targeting works well. (Click "Criteria: Everyone" to get started.)
* For more advanced targeting (e.g., progressive rollouts) or if you want to maintain targeting criteria when you launch your experiment, it’s better to reference an existing **Feature Gate**.
By default, no targeting criteria are set, so your experiment will include all allocated users within the defined **Layer** or exposed user base.
### Configure Your Groups and Parameters
When configuring **Groups and Parameters**, it’s a good idea to define your parameters first. These are the variables that control the behavior of the different experiment variants.
* Enter the values the experiment parameter will take for each variant. For more about the difference between **Groups** and **Parameters**, refer to [Groups vs. Parameters](/experiments/implementation/getting-group).
You can add additional groups by clicking the "+" next to the existing groups. The user allocation will automatically adjust as you add more groups.
* If your targeting is straightforward, creating it through Inline Targeting works well. (Click "Criteria: Everyone" to get started.)
* For more advanced targeting (e.g., progressive rollouts) or if you want to maintain targeting criteria when you launch your experiment, it’s better to reference an existing **Feature Gate**.
By default, no targeting criteria are set, so your experiment will include all allocated users within the defined **Layer** or exposed user base.
### Configure Your Groups and Parameters
When configuring **Groups and Parameters**, it’s a good idea to define your parameters first. These are the variables that control the behavior of the different experiment variants.
* Enter the values the experiment parameter will take for each variant. For more about the difference between **Groups** and **Parameters**, refer to [Groups vs. Parameters](/experiments/implementation/getting-group).
You can add additional groups by clicking the "+" next to the existing groups. The user allocation will automatically adjust as you add more groups.
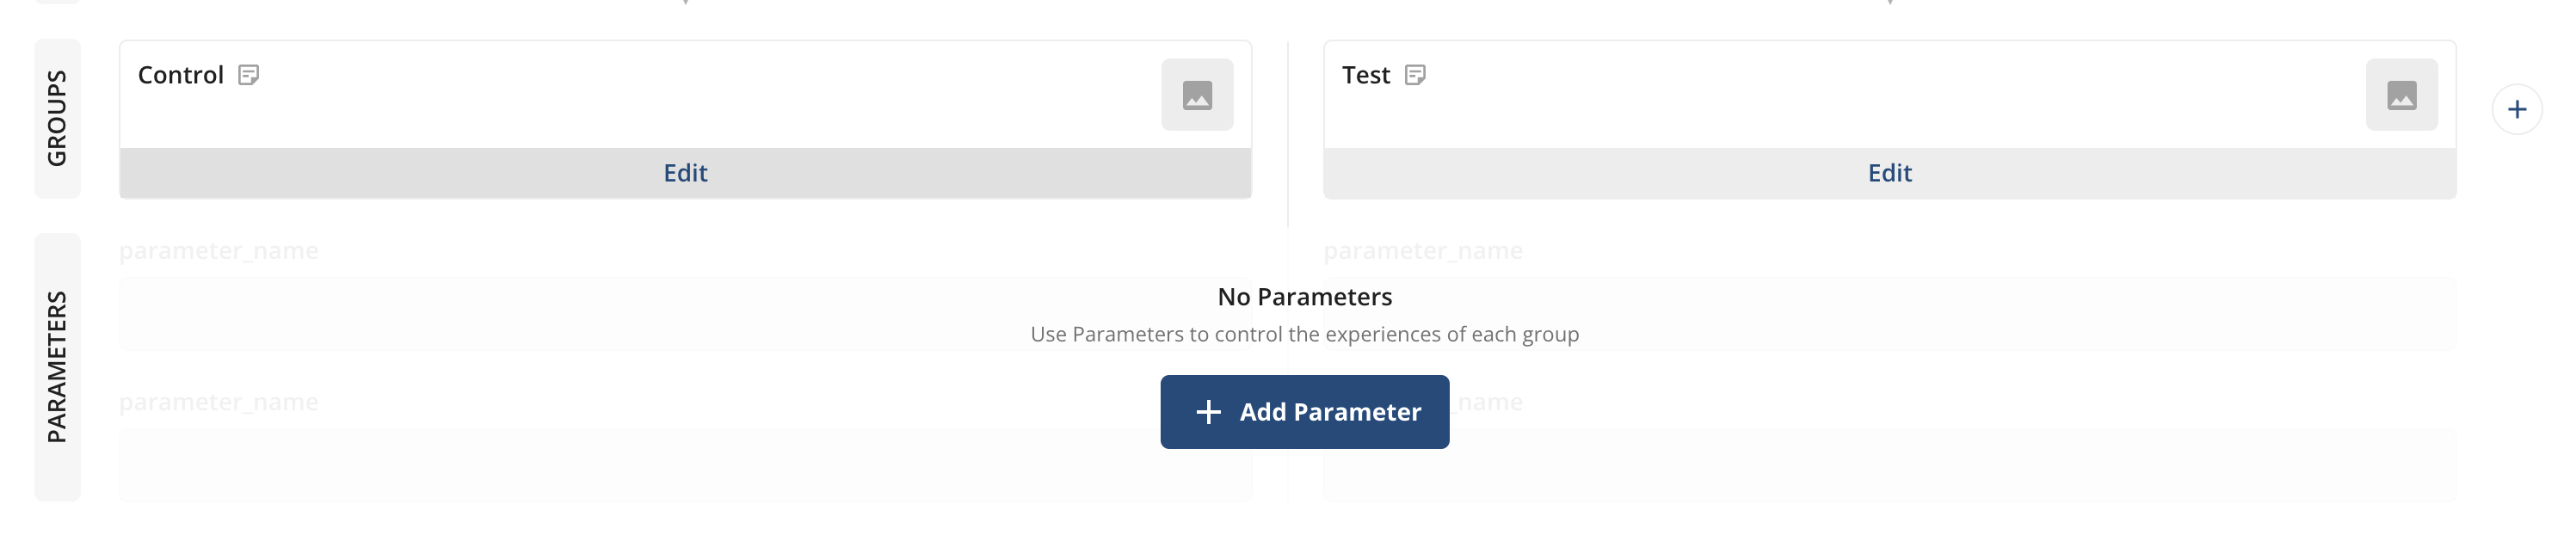 In addition, you can name, describe, and even add variant images for each group under the **Groups** section. However, only the parameters and values will affect what users see—group names and descriptions are not used in the experiment code.
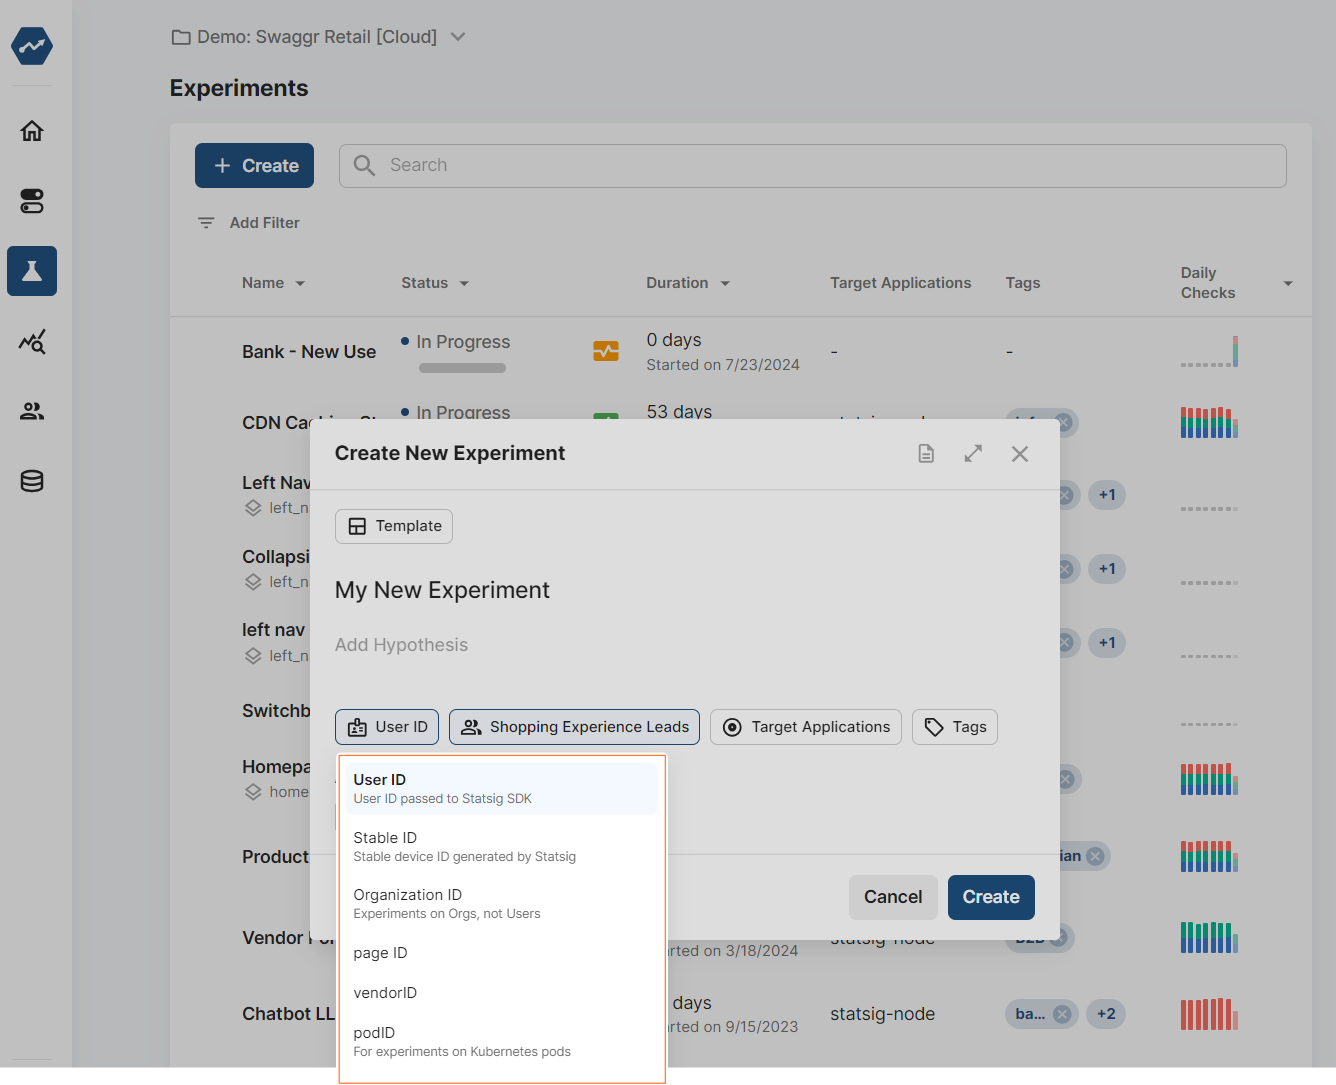
### Device-level and Custom ID Experiments
By default, experiments randomize users based on **User ID**. If you need to use a different ID type (e.g., device-level), follow steps 1–4 from the "User-level Experiments" section, then:
1. Click the **ID Type** dropdown menu and choose the desired ID type.
2. Click **Create**
In addition, you can name, describe, and even add variant images for each group under the **Groups** section. However, only the parameters and values will affect what users see—group names and descriptions are not used in the experiment code.
### Device-level and Custom ID Experiments
By default, experiments randomize users based on **User ID**. If you need to use a different ID type (e.g., device-level), follow steps 1–4 from the "User-level Experiments" section, then:
1. Click the **ID Type** dropdown menu and choose the desired ID type.
2. Click **Create**
 Afterward, continue with the same steps described above to finish configuring the experiment.
## ID Mapping Capabilities
When running experiments, you may want to start with one ID type (like stableID for device-level targeting) but analyze results using events from another ID type (like userID for logged-in user metrics).
**Warehouse Native**: Supports ID mapping between different identifier types (e.g., stableID to userID) through Entity Property Source configuration.
**Cloud**: Currently does not support mapping between different ID types. Experiments started with stableID will only analyze events with stableID, and experiments started with userID will only analyze events with userID.
For advanced ID mapping requirements, consider using Statsig Warehouse Native.
### Isolated Experiments
If you want to create an experiment that excludes users exposed to other experiments, follow steps 1–4 from the "User-level Experiments" section. Then:
1. Select **Advanced** options.
2. Select an existing **Layer** or create a new one.
3. Click **Create**.
Afterward, continue with the same steps described above to finish configuring the experiment.
## ID Mapping Capabilities
When running experiments, you may want to start with one ID type (like stableID for device-level targeting) but analyze results using events from another ID type (like userID for logged-in user metrics).
**Warehouse Native**: Supports ID mapping between different identifier types (e.g., stableID to userID) through Entity Property Source configuration.
**Cloud**: Currently does not support mapping between different ID types. Experiments started with stableID will only analyze events with stableID, and experiments started with userID will only analyze events with userID.
For advanced ID mapping requirements, consider using Statsig Warehouse Native.
### Isolated Experiments
If you want to create an experiment that excludes users exposed to other experiments, follow steps 1–4 from the "User-level Experiments" section. Then:
1. Select **Advanced** options.
2. Select an existing **Layer** or create a new one.
3. Click **Create**.
 Now, complete the rest of the experiment setup as described above.
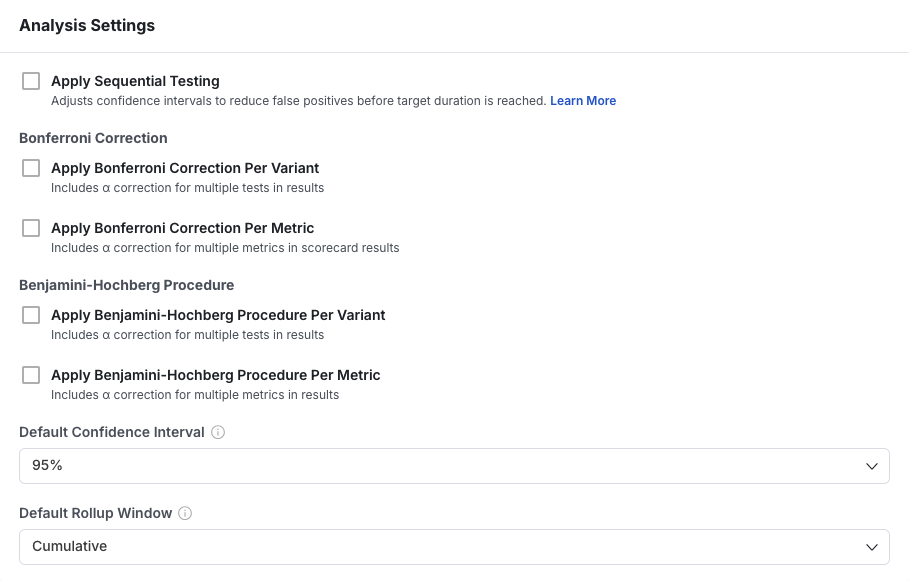
### Significance Level Adjustments
By default, Experiment Results display with 95% confidence intervals and without Bonferroni correction. This can be customized during experiment setup or later when viewing results in Experiment Results.
* **Bonferroni Correction:** Apply this to reduce the risk of false positives in experiments with multiple test groups. The significance level (*α*) is divided by the number of test variants.
* **Default Confidence Interval:** Choose a lower confidence interval (e.g., 80%) if you prefer faster results with higher tolerance for false positives, or stick with 95% for greater certainty.
Now, complete the rest of the experiment setup as described above.
### Significance Level Adjustments
By default, Experiment Results display with 95% confidence intervals and without Bonferroni correction. This can be customized during experiment setup or later when viewing results in Experiment Results.
* **Bonferroni Correction:** Apply this to reduce the risk of false positives in experiments with multiple test groups. The significance level (*α*) is divided by the number of test variants.
* **Default Confidence Interval:** Choose a lower confidence interval (e.g., 80%) if you prefer faster results with higher tolerance for false positives, or stick with 95% for greater certainty.
 ### Target Duration
Setting a target duration is optional, but it helps ensure that you wait long enough for the experiment to reach full power. You can set the target as either a specific number of days or a number of exposures, and use the [**Power Analysis Calculator**](/experiments-plus/power-analysis) to determine what target works best for your metrics.
### Target Duration
Setting a target duration is optional, but it helps ensure that you wait long enough for the experiment to reach full power. You can set the target as either a specific number of days or a number of exposures, and use the [**Power Analysis Calculator**](/experiments-plus/power-analysis) to determine what target works best for your metrics.
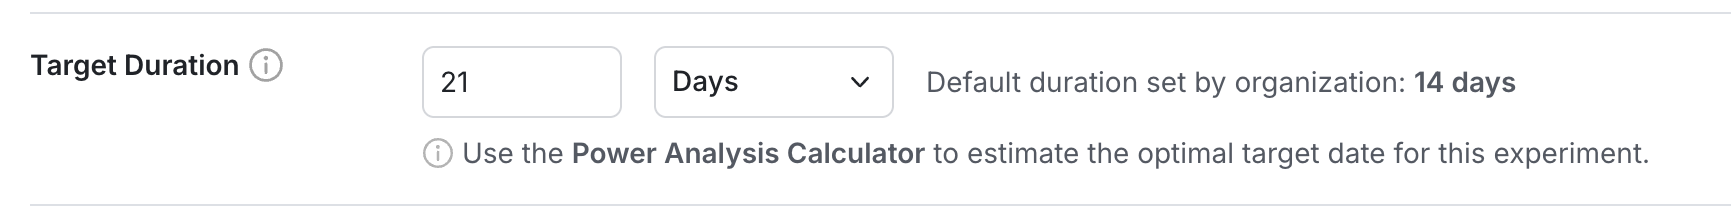 💡 **Target durations longer than 90 days:** By default, Statsig computes Experiment Results results for the first 90 days, though the experiment itself can run longer. Before setting a duration beyond 90 days, ask yourself if results past that period will still be relevant, and if earlier data might already provide the insights you need.
 Once set, you can track progress against the target duration/exposures in the experiment header. You’ll also receive notifications via email and Slack (if integrated) when the target is reached.
***
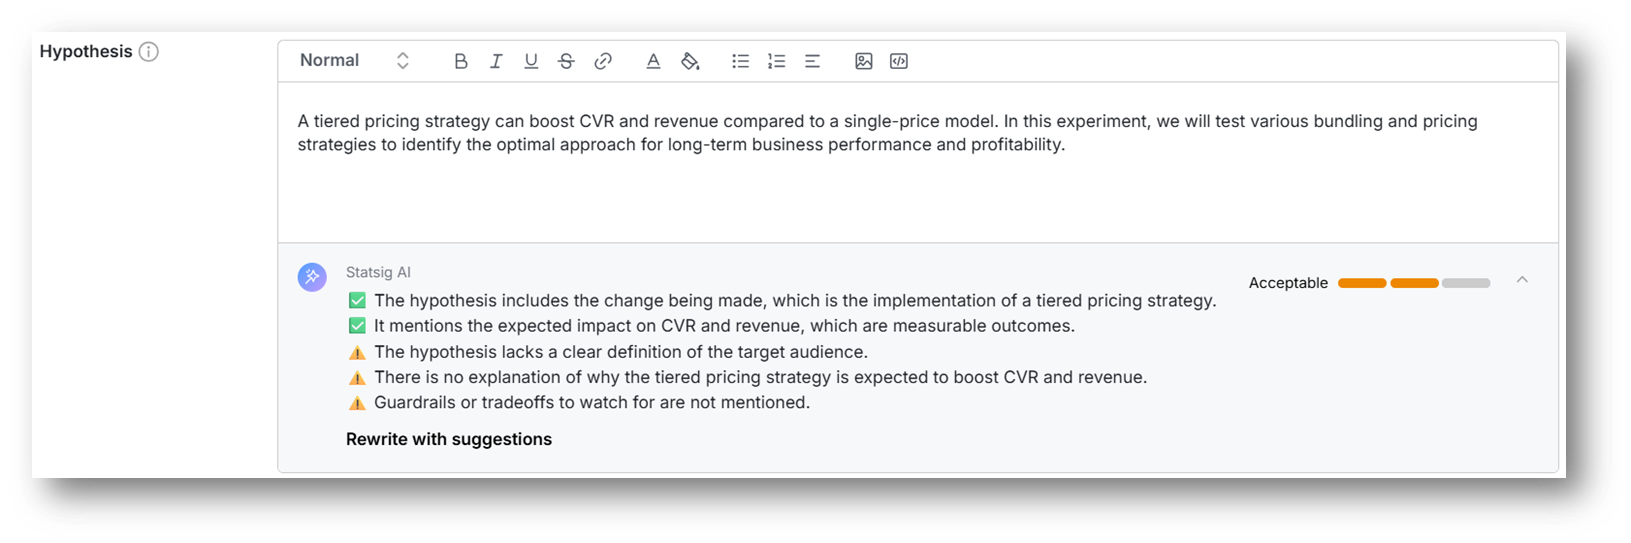
### Hypothesis Advisor
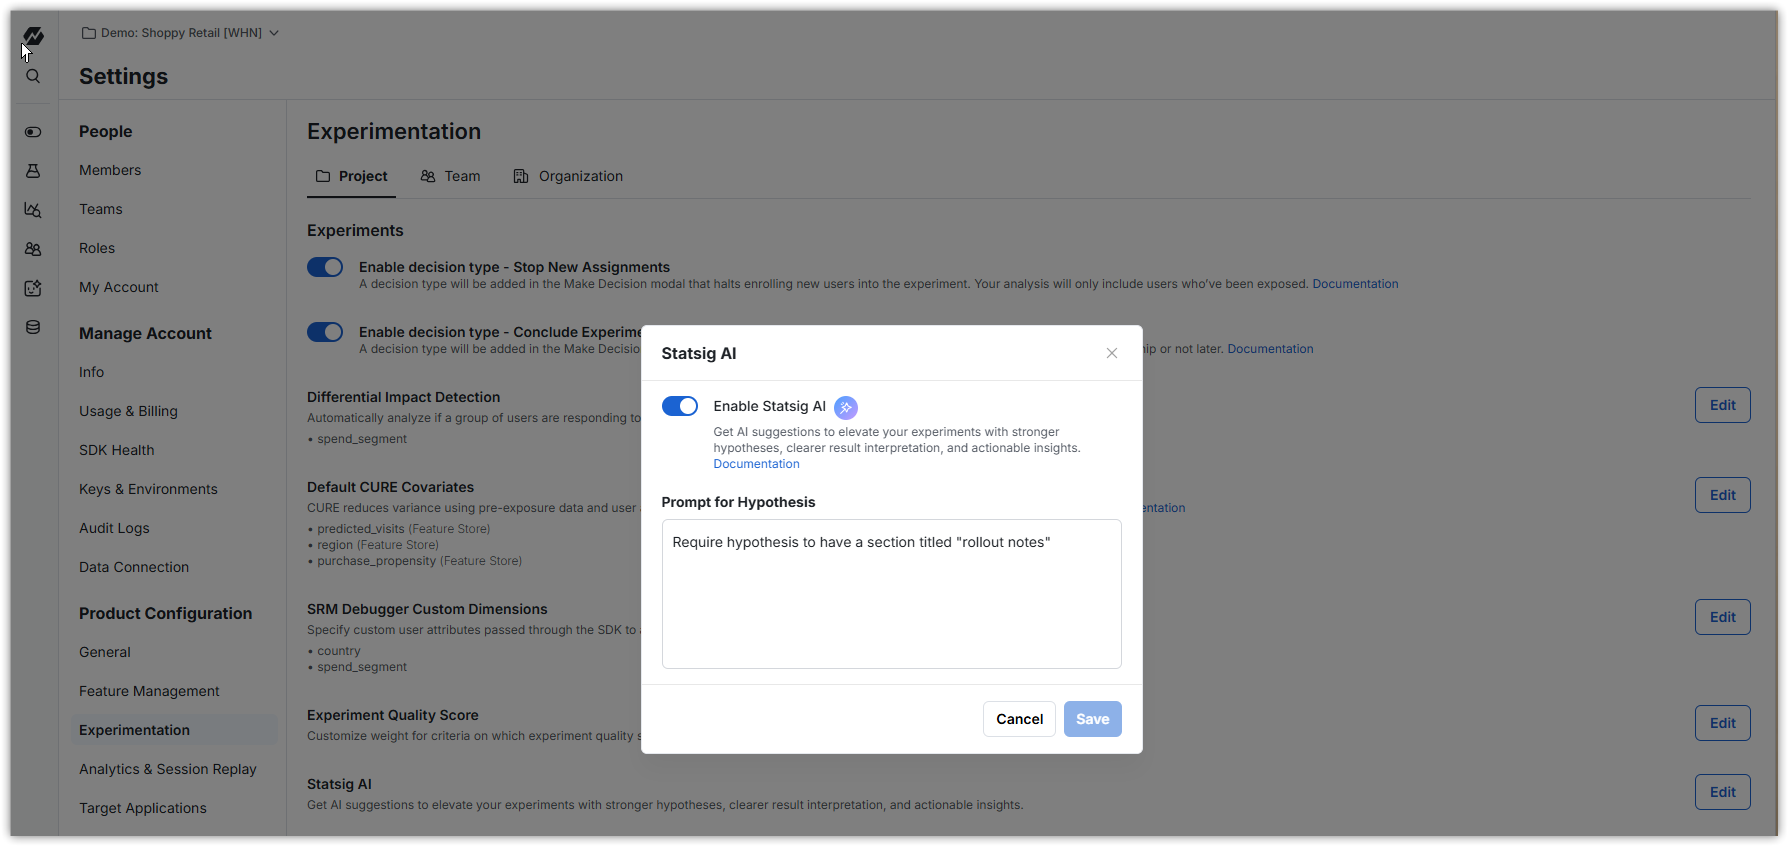
Writing good experiment hypotheses is key to a strong experimentation culture. Statsig now gives instant feedback on experiment hypotheses—flagging what’s missing. Admins can set custom requirements, which Statsig uses to guide experimenters toward stronger, more complete hypotheses.
This Statsig AI feature is default disabled and has to be enabled for your project.
Do this from Settings -> Experiment -> Project -> Statsig AI.
This is also where you configure any custom requirements you want Hypothesis Advisor to ensure adherence to (e.g. "Strongly recommend that a validation plan be mentioned").
Once set, you can track progress against the target duration/exposures in the experiment header. You’ll also receive notifications via email and Slack (if integrated) when the target is reached.
***
### Hypothesis Advisor
Writing good experiment hypotheses is key to a strong experimentation culture. Statsig now gives instant feedback on experiment hypotheses—flagging what’s missing. Admins can set custom requirements, which Statsig uses to guide experimenters toward stronger, more complete hypotheses.
This Statsig AI feature is default disabled and has to be enabled for your project.
Do this from Settings -> Experiment -> Project -> Statsig AI.
This is also where you configure any custom requirements you want Hypothesis Advisor to ensure adherence to (e.g. "Strongly recommend that a validation plan be mentioned").