> ## Documentation Index
> Fetch the complete documentation index at: https://statsig-4b2ff144-serverless-cloudflare.mintlify.site/llms.txt
> Use this file to discover all available pages before exploring further.
# Running Analysis Across Unit Types, AKA Cluster Experiments
> Learn how to run analysis when the experiment assignment unit differs from the analysis unit.
There are two common scenarios where the experiment assignment unit differs from the analysis unit:
1. Measuring session-level metrics for a user-level experiment. Ratio metrics are commonly used to solve this (this doc).
2. Measuring logged-in metrics (eg. revenue) on a logged-out experiment. There are two solutions:
a. Running the experiment at the [device-level](/guides/first-device-level-experiment), with device-level metrics collected even after the user is logged-in.
b. Using [ID resolution](/statsig-warehouse-native/features/id-resolution).
We will explain how to set up the first scenario with Warehouse Native in this doc.
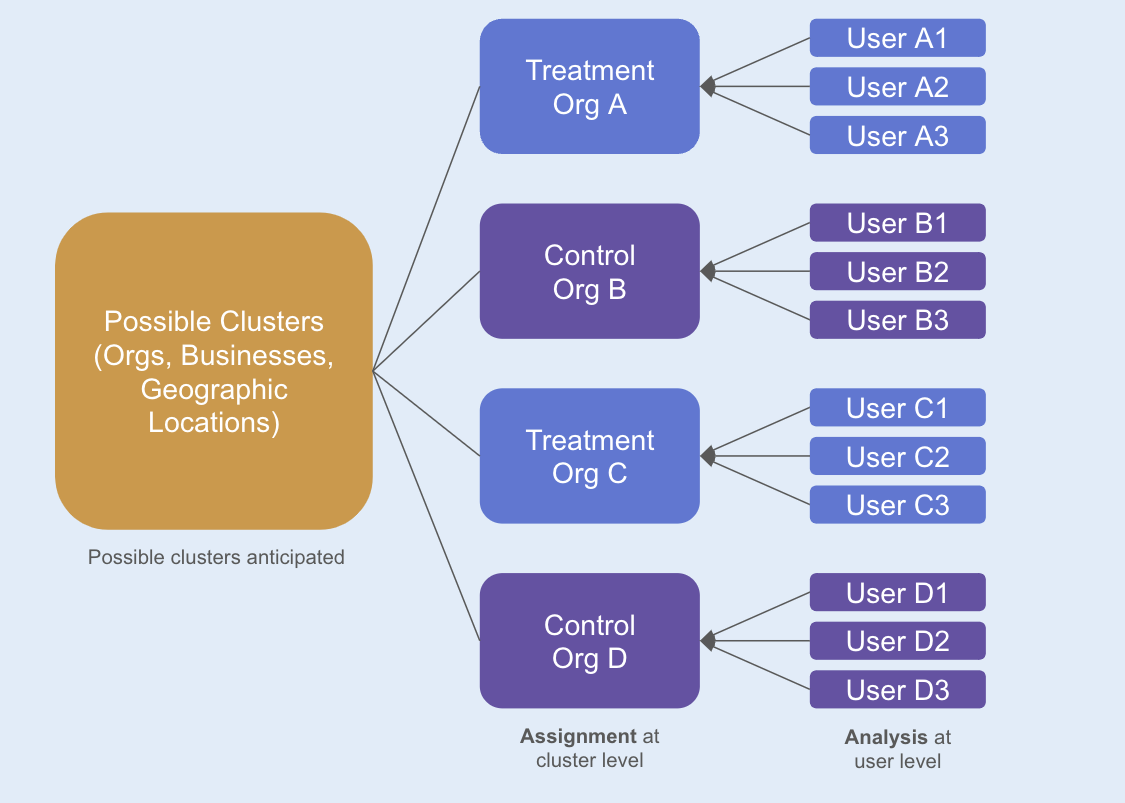 ## Example: Organizations and Users
Scenario:
* Your metrics source has both `org_id` and `user_id`.
* The relationship between `org_id` and `user_id` is 1-to-many. A single `org_id` can be associated with multiple users (`user_id`), but a `user_id` is only associated with a single `org_id`.
* Your experiment is assigned at the `org_id` level.
* You are interested in understanding the treatment effect at the `user_id` level, such as revenue per user.
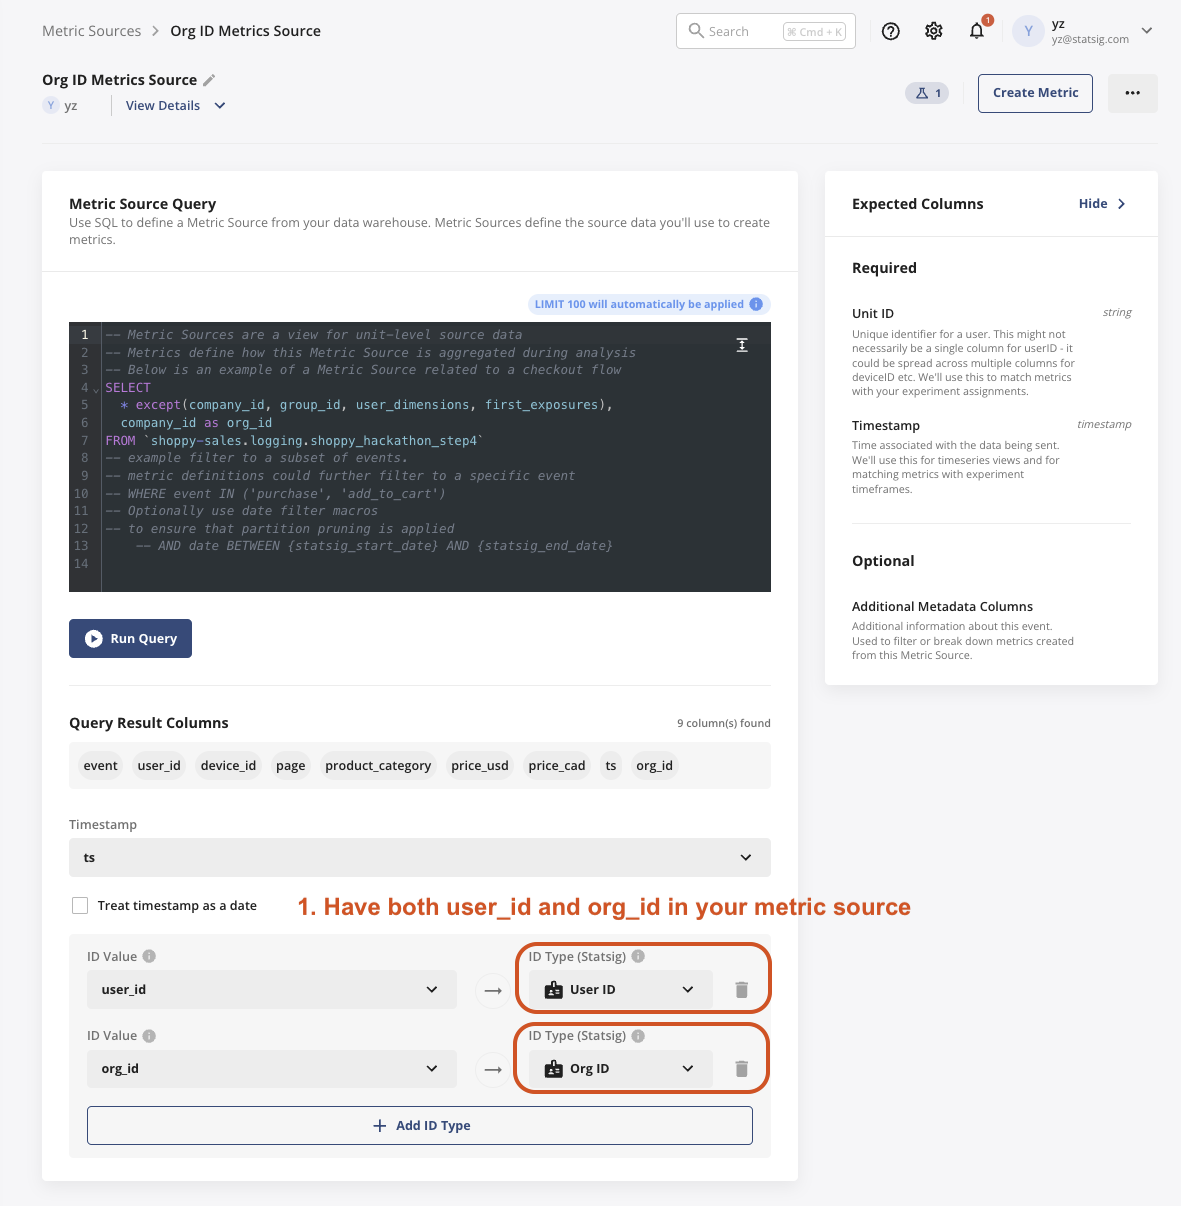
### 1. Setup the metric source with `org_id` as an ID type.
* In this table, each row of data should have both `org_id` and `user_id`.
## Example: Organizations and Users
Scenario:
* Your metrics source has both `org_id` and `user_id`.
* The relationship between `org_id` and `user_id` is 1-to-many. A single `org_id` can be associated with multiple users (`user_id`), but a `user_id` is only associated with a single `org_id`.
* Your experiment is assigned at the `org_id` level.
* You are interested in understanding the treatment effect at the `user_id` level, such as revenue per user.
### 1. Setup the metric source with `org_id` as an ID type.
* In this table, each row of data should have both `org_id` and `user_id`.
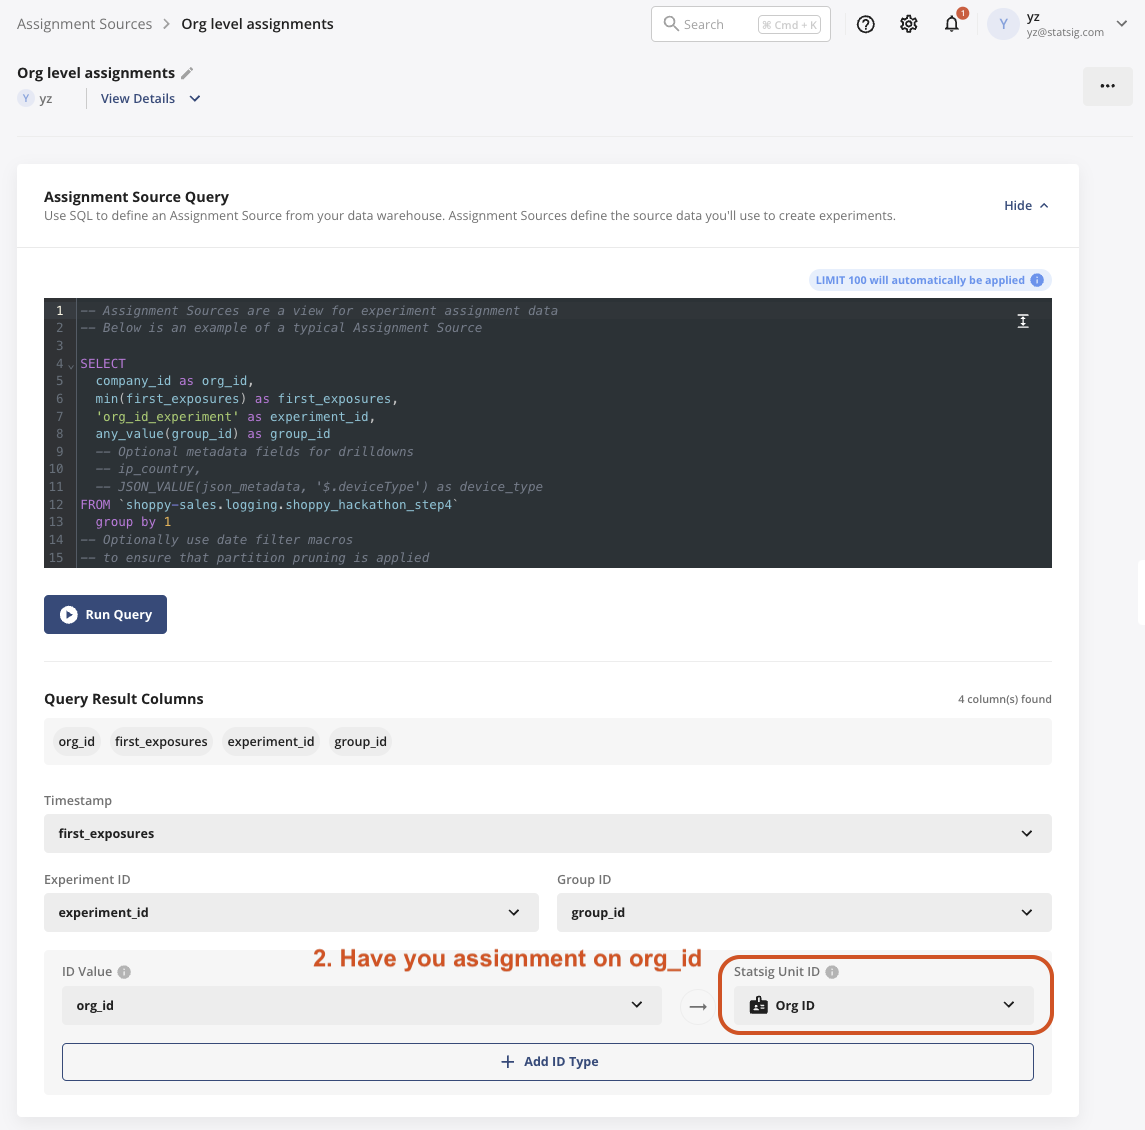
 ### 2. Choose your assignment source, where the unit of assignment is `org_id`.
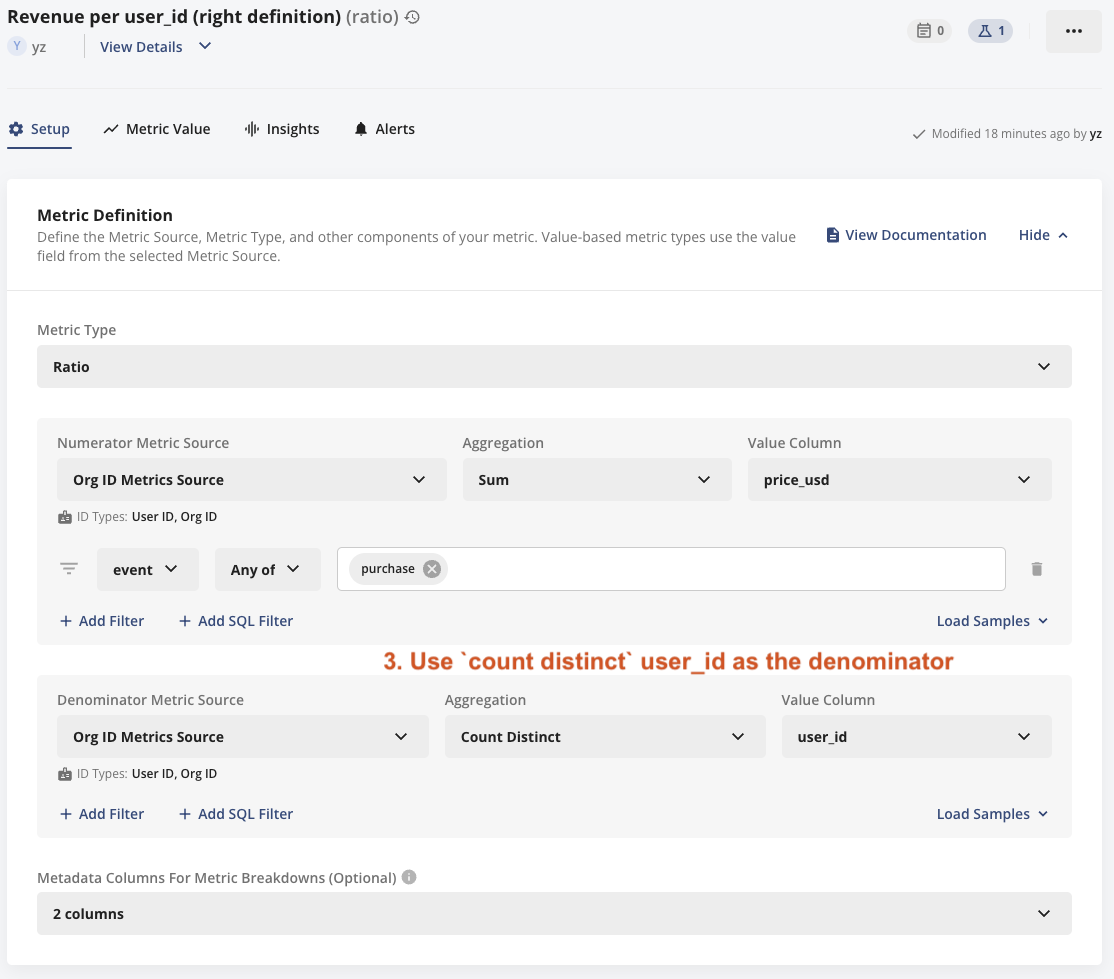
 ### 3. Define your metric of revenue per `user_id`.
* Your denominator should be `count distinct user_id` instead of `unit count`, because the latter is equivalent to `count distinct org_id` in an `org_id` level experiment.
### 3. Define your metric of revenue per `user_id`.
* Your denominator should be `count distinct user_id` instead of `unit count`, because the latter is equivalent to `count distinct org_id` in an `org_id` level experiment.
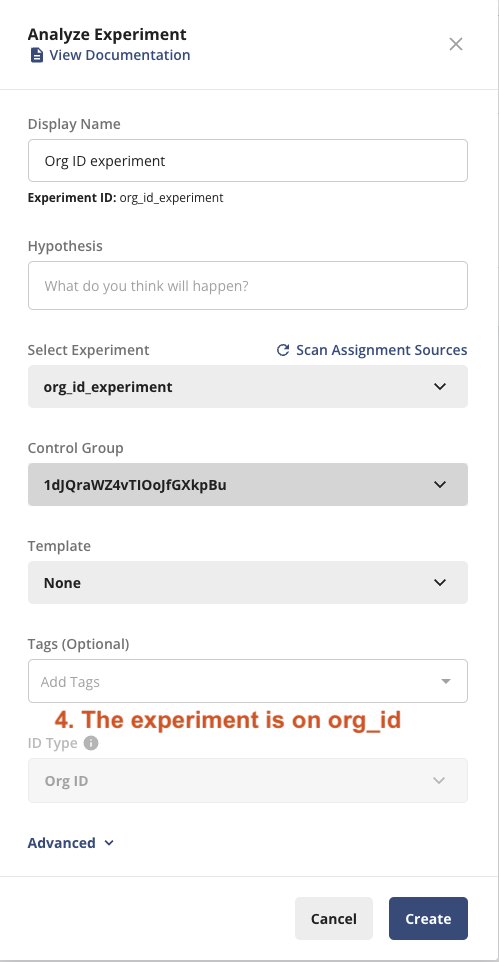
 ### 4. Set up the experiment with `org_id`
 ## Statistics in the backend
In the Stats Engine, we utilize the delta method to calculate variance and confidence intervals.
* For mean metrics, we record a value indicating the number of observations per exposed unit in the records column of the staging data. This acts as the denominator or cluster-size value for delta calculations.
* For general ratio metrics, we monitor the two-component metrics (the ratio and the denominator) as independent metrics and combine them during the pulse analysis to derive a single metric from them.
For more information on how we apply the delta method, visit: [Statsig - Delta Method Methodology.](/stats-engine/methodologies/delta-method). The reason we choose to use the delta method is to account for the covariance between the numerator and the denominator (i.e. more users per org is correlated with more revenue). See section 3 of [this paper](https://alexdeng.github.io/public/files/kdd2018-dm.pdf) for details.
This approach is also relevant for analyzing event-level outcomes, such as average purchase value, where randomization occurs at the user level, and each user may experience multiple session events.
## Statistics in the backend
In the Stats Engine, we utilize the delta method to calculate variance and confidence intervals.
* For mean metrics, we record a value indicating the number of observations per exposed unit in the records column of the staging data. This acts as the denominator or cluster-size value for delta calculations.
* For general ratio metrics, we monitor the two-component metrics (the ratio and the denominator) as independent metrics and combine them during the pulse analysis to derive a single metric from them.
For more information on how we apply the delta method, visit: [Statsig - Delta Method Methodology.](/stats-engine/methodologies/delta-method). The reason we choose to use the delta method is to account for the covariance between the numerator and the denominator (i.e. more users per org is correlated with more revenue). See section 3 of [this paper](https://alexdeng.github.io/public/files/kdd2018-dm.pdf) for details.
This approach is also relevant for analyzing event-level outcomes, such as average purchase value, where randomization occurs at the user level, and each user may experience multiple session events.