> ## Documentation Index
> Fetch the complete documentation index at: https://statsig-4b2ff144-serverless-cloudflare.mintlify.site/llms.txt
> Use this file to discover all available pages before exploring further.

# Topline Alerts

> Get notified when metrics shift beyond a fixed threshold or relative change in value.

Topline Alerts are available in Statsig Cloud and Statsig Warehouse Native.

Statsig currently supports three types of Topline Alerts:

| Alert Condition Type | When to Use                                                             | Example                                                     |
| -------------------- | ----------------------------------------------------------------------- | ----------------------------------------------------------- |
| **Threshold**        | Use when you want to stay above or below a fixed number.                | “Alert me when P90 latency spikes above 15 seconds.”        |
| **Change**           | Use when the absolute size of the change matters.                       | “Alert me when hourly P90 latency increases by 10 seconds.” |
| **Change (%)**       | Use when the relative size of the change matters more than raw numbers. | “Alert me when hourly P90 latency increases by 50%.”        |

## Creating a Topline Alert

<Steps>
  <Step title="Navigate to Topline Alerts">
    Go to <strong>Analytics → Topline Alerts</strong> in the product menu.
  </Step>

  <Step title="Create a New Alert">
    Click <strong>+Create</strong> and give the new alert a name.
  </Step>

  <Step title="Select the Event or Metric Source">
    <p>Pick the data you want to monitor.
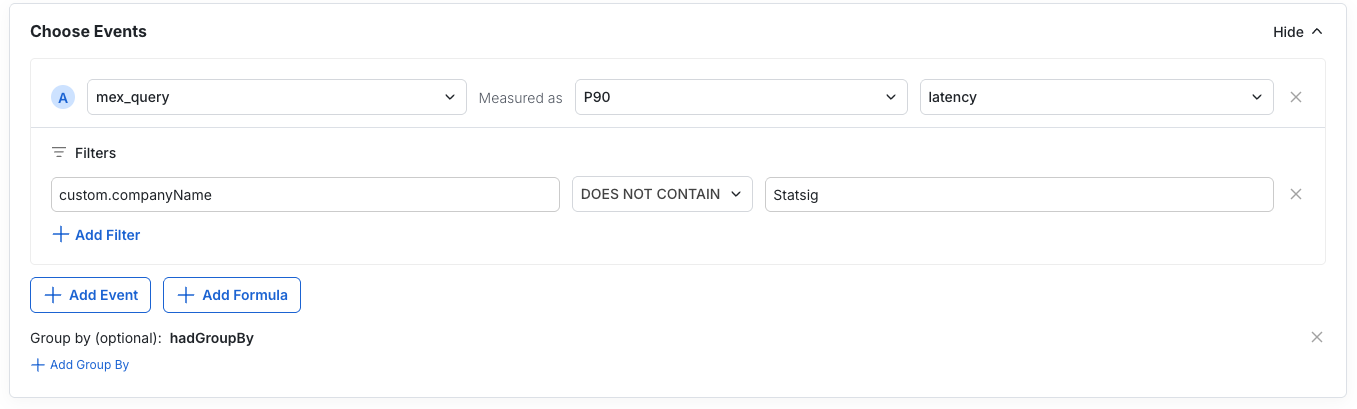
</p>

    <ul>
      <li><strong>On Statsig Warehouse Native:</strong> Select a Metric Source, filter, and group by your desired dimensions.</li>
      <li><strong>On Statsig Cloud:</strong> Select the event, aggregation, filters, and group-by conditions for this alert.</li>
    </ul>

    <Info title="Example">
      We're setting up an alert to monitor P90 latency for <code>mex\_query</code> events, filtering out internal employee queries and grouping by the <code>hadGroupBy</code> dimension.
    </Info>

    <Frame>
      <img src="https://mintcdn.com/statsig-4b2ff144-serverless-cloudflare/4Y9GDUOpHMGP4hLA/images/infra-analytics/topline-alerts-choose-events.png?fit=max&auto=format&n=4Y9GDUOpHMGP4hLA&q=85&s=8e5cb5f3d95386addea1db7e4eca34da" alt="Select events or metrics for a Topline Alert" width="1357" height="409" data-path="images/infra-analytics/topline-alerts-choose-events.png" />
    </Frame>
  </Step>

  <Step title="Review the Alert Preview">
    <p>The preview shows how your metric is trending with the current setup. Confirm values look correct, or open the metric in <a href="/product-analytics/drilldown">Metrics Explorer</a> for deeper analysis.</p>

    <Frame>
      <img src="https://mintcdn.com/statsig-4b2ff144-serverless-cloudflare/4Y9GDUOpHMGP4hLA/images/infra-analytics/topline-alerts-preview.png?fit=max&auto=format&n=4Y9GDUOpHMGP4hLA&q=85&s=0b6416aea2eb995300a2cbc9dcdafca6" alt="Topline Alert preview showing trending metric" width="1352" height="365" data-path="images/infra-analytics/topline-alerts-preview.png" />
    </Frame>
  </Step>

  <Step title="Set Alert Conditions">
    <p>
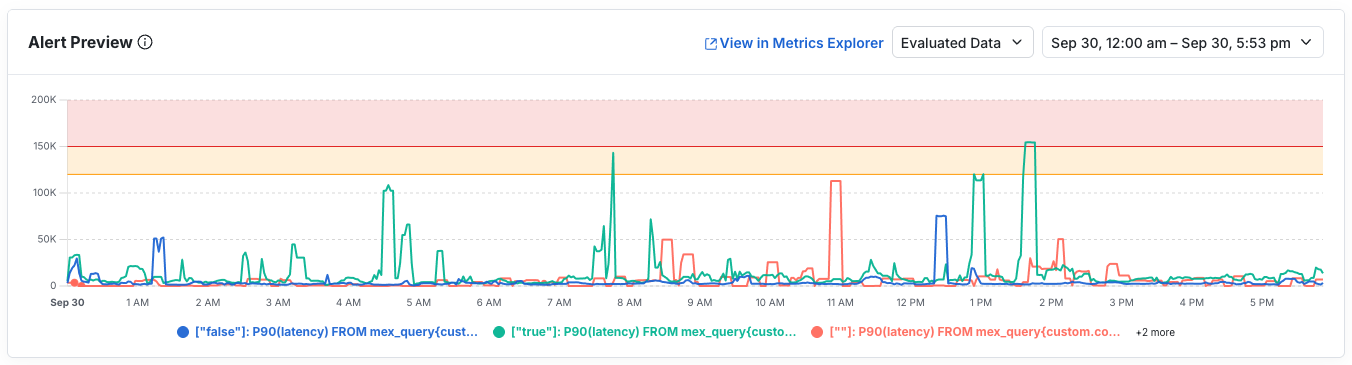
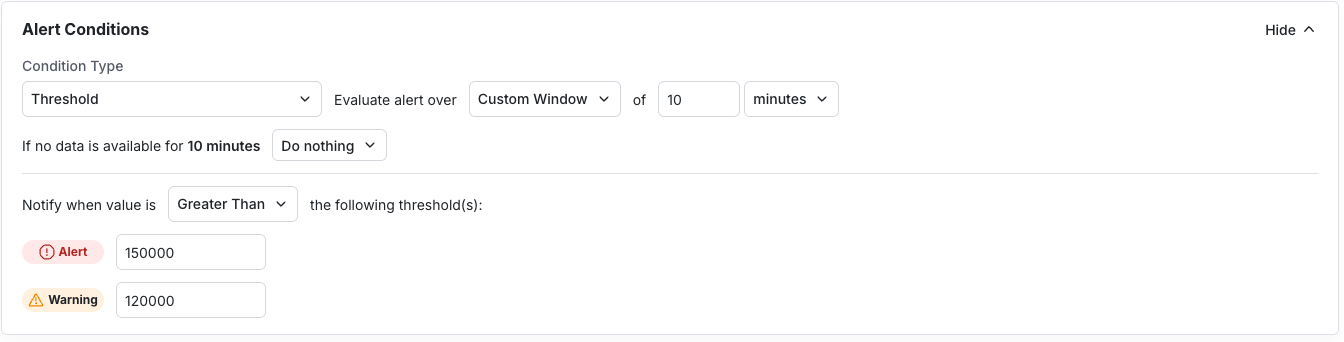
The preview updates along with each change. Define the:</p>

    <ul>
      <li>Condition type (threshold, change, change %)</li>
      <li>Directionality</li>
      <li><em>Alert</em> and <em>Warn</em> values</li>
      <li>Evaluation window</li>
    </ul>

    <Warning>
      On Warehouse Native: Define the evaluation frequency, lookback, and max delay—they directly influence warehouse compute costs.
    </Warning>

    <Frame>
      <img src="https://mintcdn.com/statsig-4b2ff144-serverless-cloudflare/4Y9GDUOpHMGP4hLA/images/infra-analytics/topline-alerts-conditions.png?fit=max&auto=format&n=4Y9GDUOpHMGP4hLA&q=85&s=d066c00b0199df0efa650de76364d20b" alt="Configure alert conditions for a Topline Alert" width="1344" height="342" data-path="images/infra-analytics/topline-alerts-conditions.png" />
    </Frame>
  </Step>

  <Step title="Add Notifications">
    <p>Notifications go to email, the Statsig Console, and Slack (if connected). Project-wide defaults live in Settings.</p>

    <ul>
      <li>Draft a clear, actionable message subscribers receive when the alert fires.</li>
      <li>Add subscribers.</li>
      <li>Set alert priority.</li>
      <li>Configure re-notification rules if alerts should resend while conditions hold.</li>
    </ul>
  </Step>

  <Step title="Save and Monitor">
    <p>
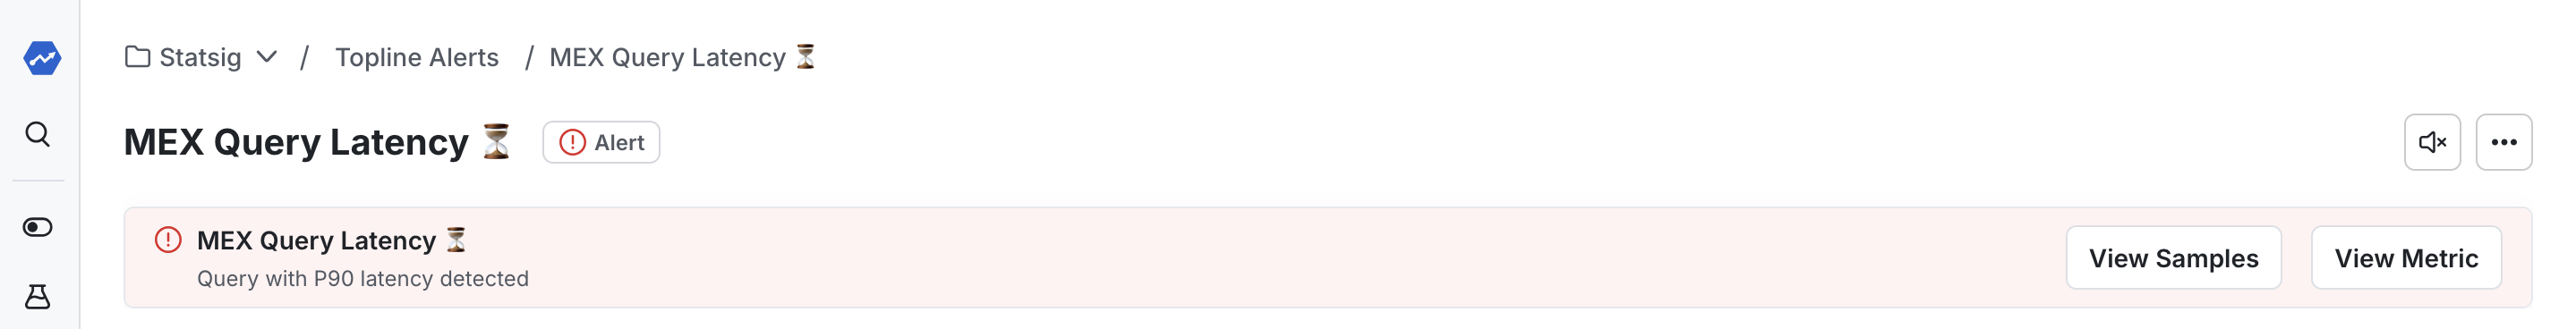
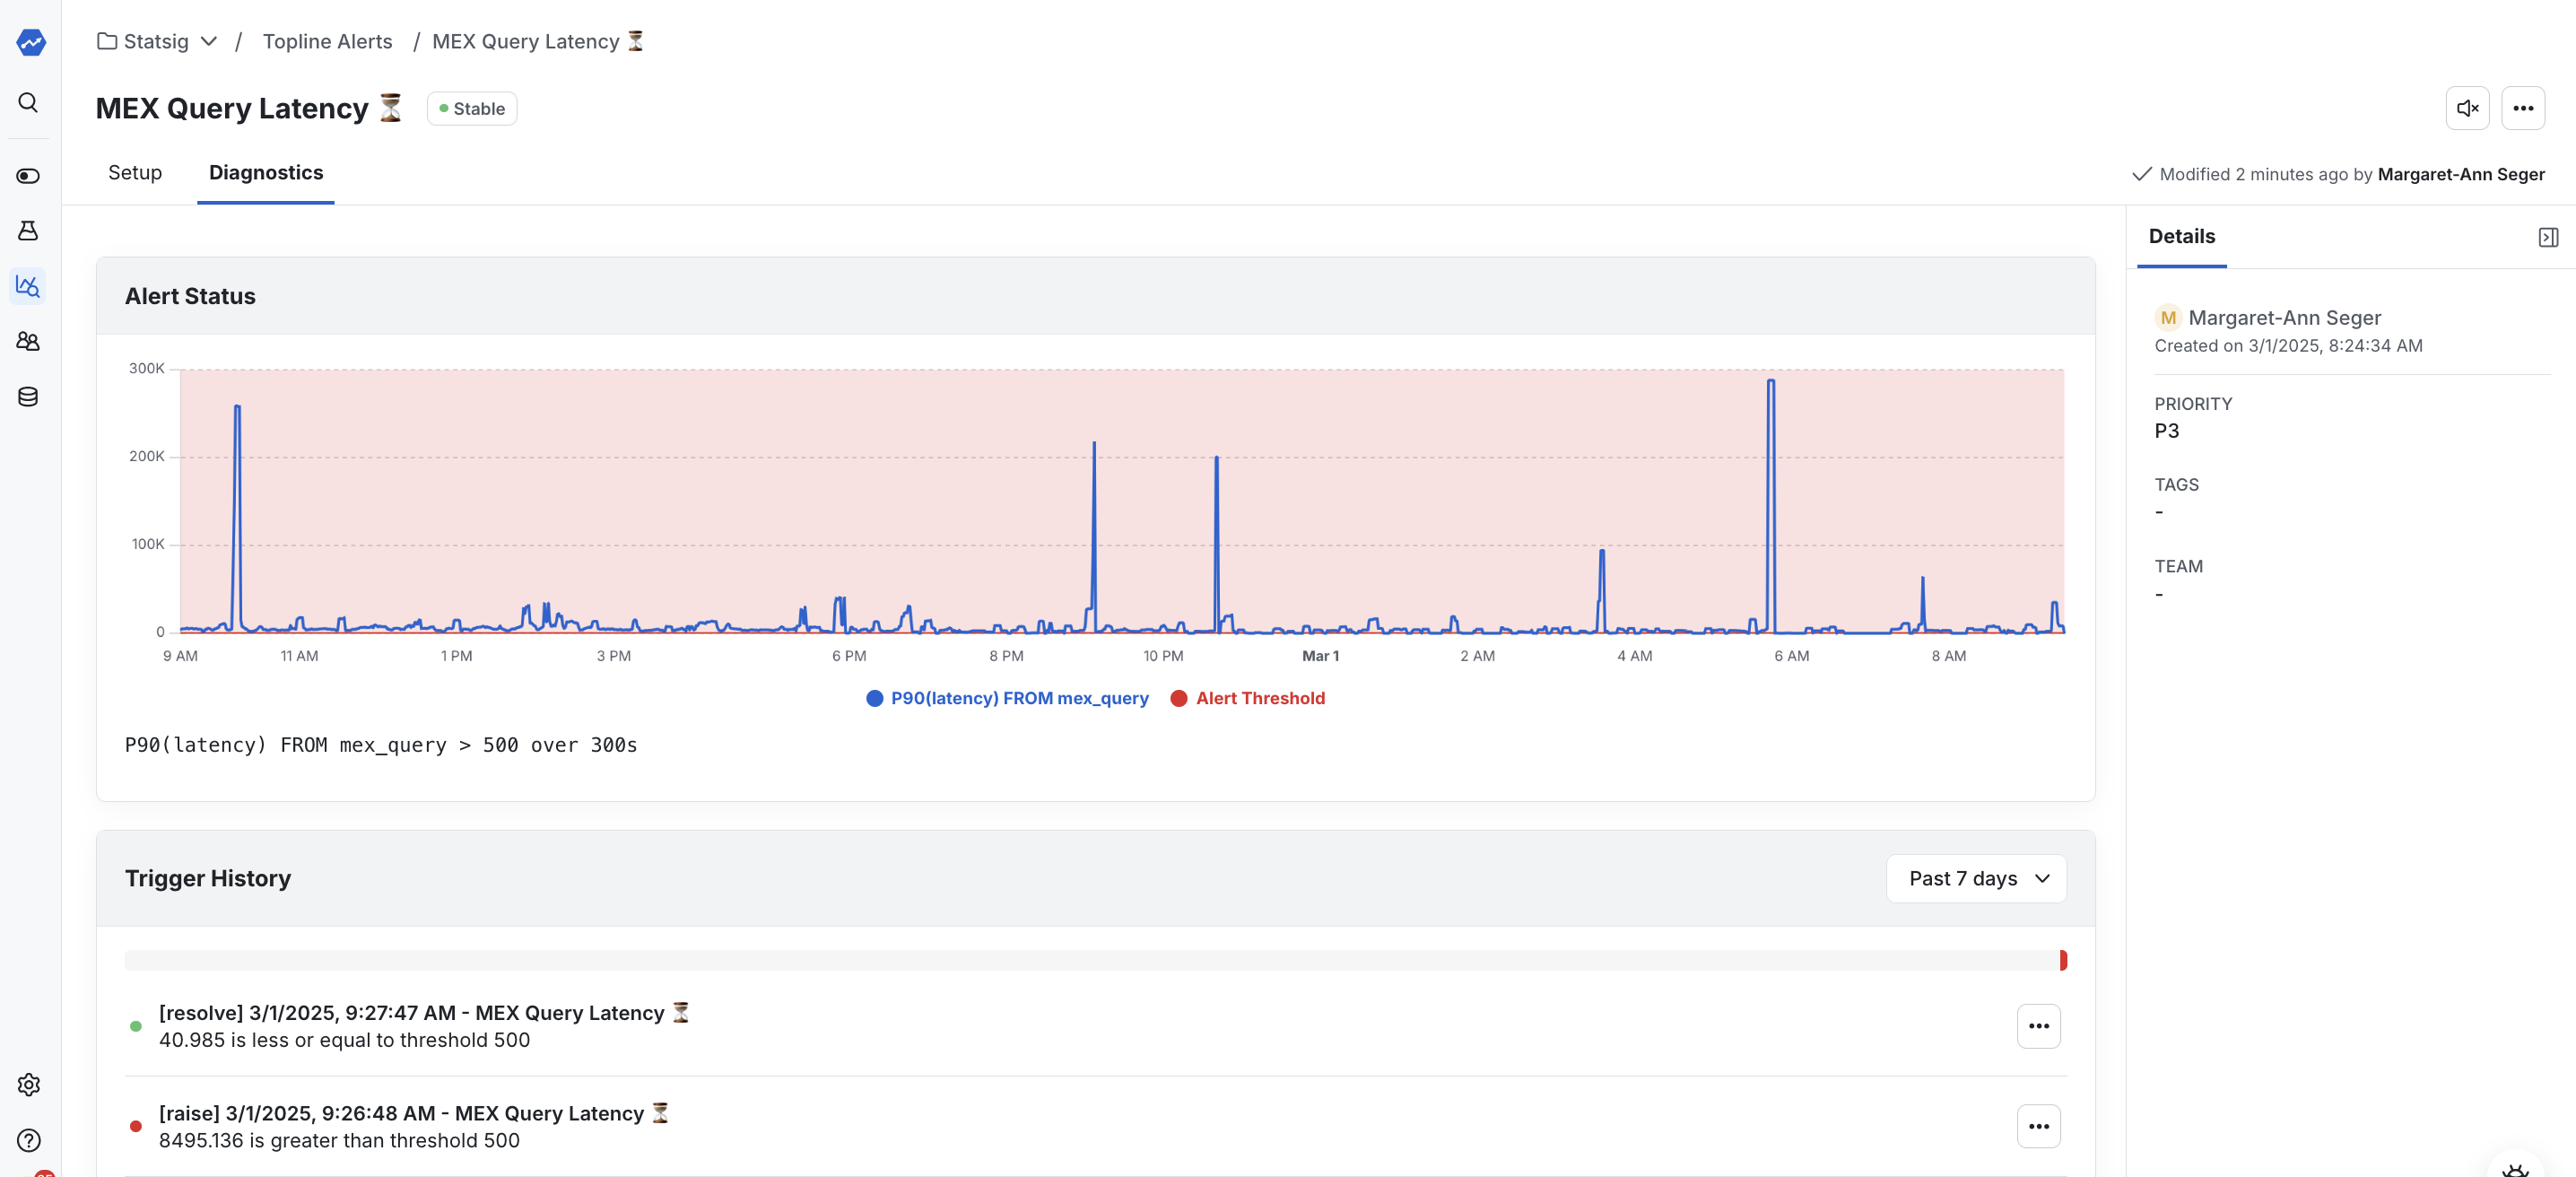
Once saved, triggered alerts appear at the top of the page. From here you can:</p>

    <ul>
      <li>View samples of the event.</li>
      <li>Open the trend in <a href="/product-analytics/drilldown">Metrics Explorer</a>.</li>
      <li>Mute the alert temporarily if it is noisy or already under investigation.</li>
    </ul>

    <Frame>
      <img src="https://mintcdn.com/statsig-4b2ff144-serverless-cloudflare/0ENSucKrRSrgZacm/images/product-analytics/topline-alerts-overview.png?fit=max&auto=format&n=0ENSucKrRSrgZacm&q=85&s=2c670e4b854dce2fa6229b6612f5af15" alt="Topline Alerts table with active alerts" width="2878" height="368" data-path="images/product-analytics/topline-alerts-overview.png" />
    </Frame>
  </Step>
</Steps>

## Diagnostics

Head to the <strong>Diagnostics</strong> tab to review alert history, inspect samples, jump into Metrics Explorer, or mute noisy alerts.

<Frame>
  <img src="https://mintcdn.com/statsig-4b2ff144-serverless-cloudflare/0ENSucKrRSrgZacm/images/product-analytics/topline-alerts-diagnostics.png?fit=max&auto=format&n=0ENSucKrRSrgZacm&q=85&s=a19e828b31511d129c58d43e433d914e" alt="Diagnostics tab showing alert history" width="2872" height="1312" data-path="images/product-analytics/topline-alerts-diagnostics.png" />
</Frame>

***

## Interested in More?

* 👉 Check out how to [create a Topline Alert on log lines](/infra-analytics/topline-alerts-logs)
* 🔔 Learn how to set up [team Slack notifications](/integrations/slack/#team-notifications)
