User Revenue from a Wide Table
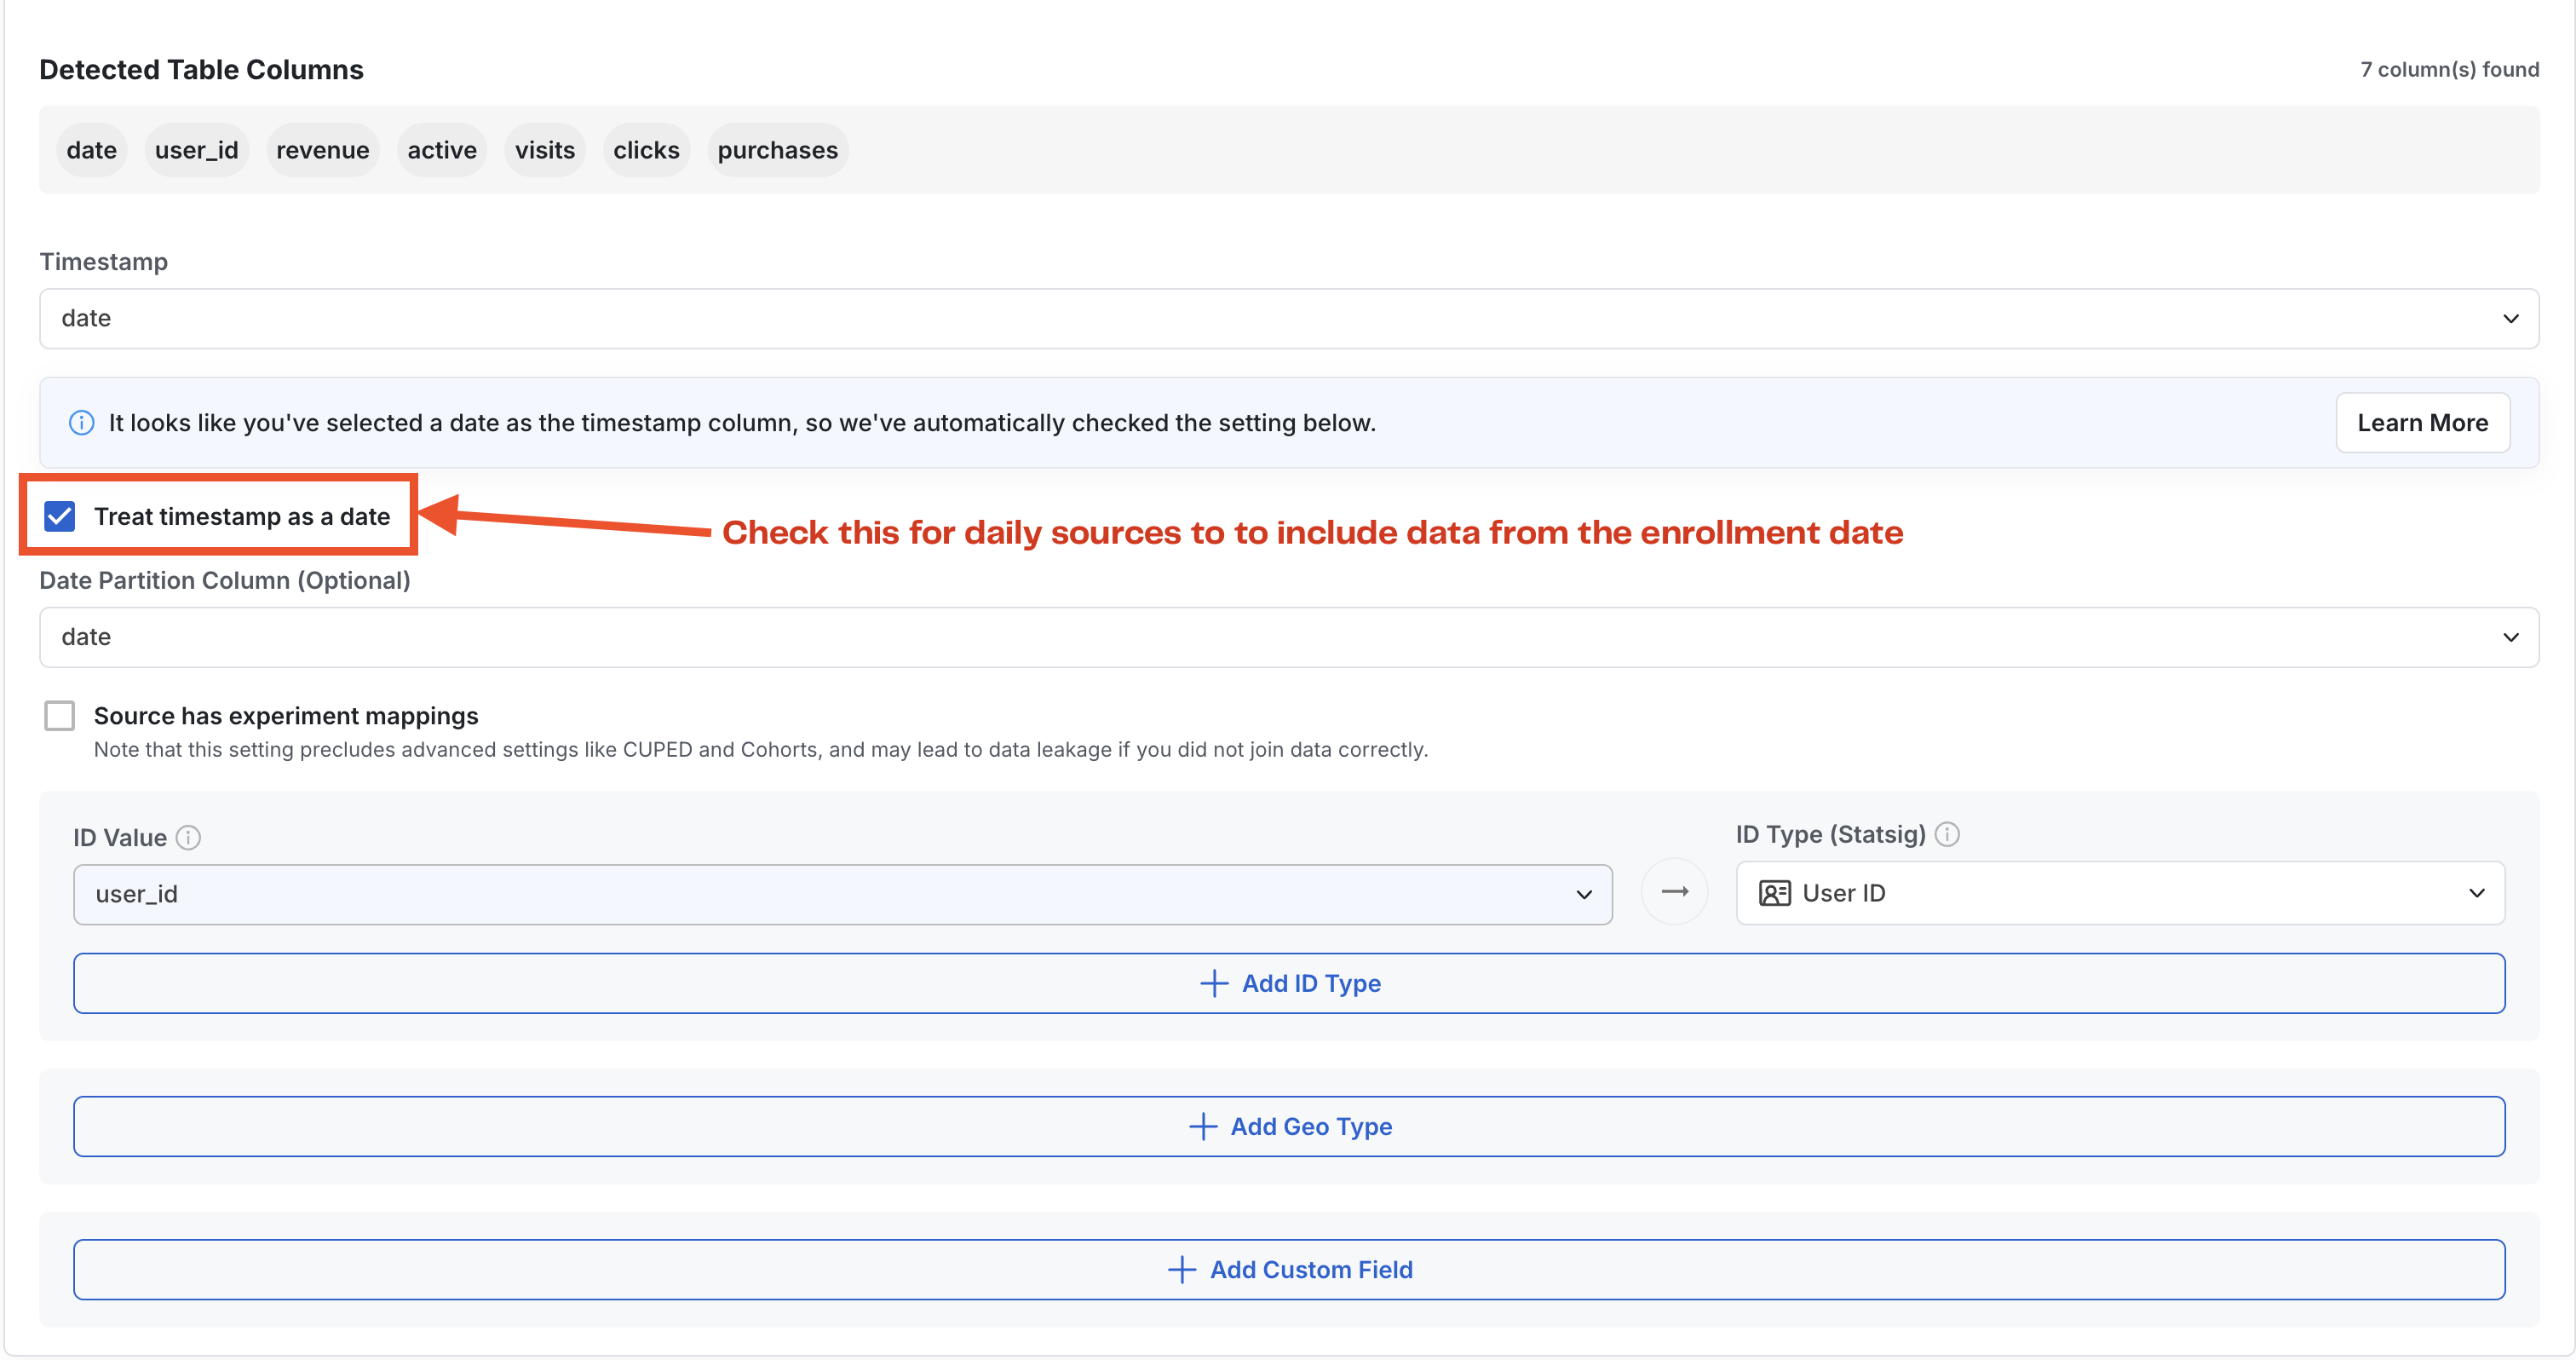
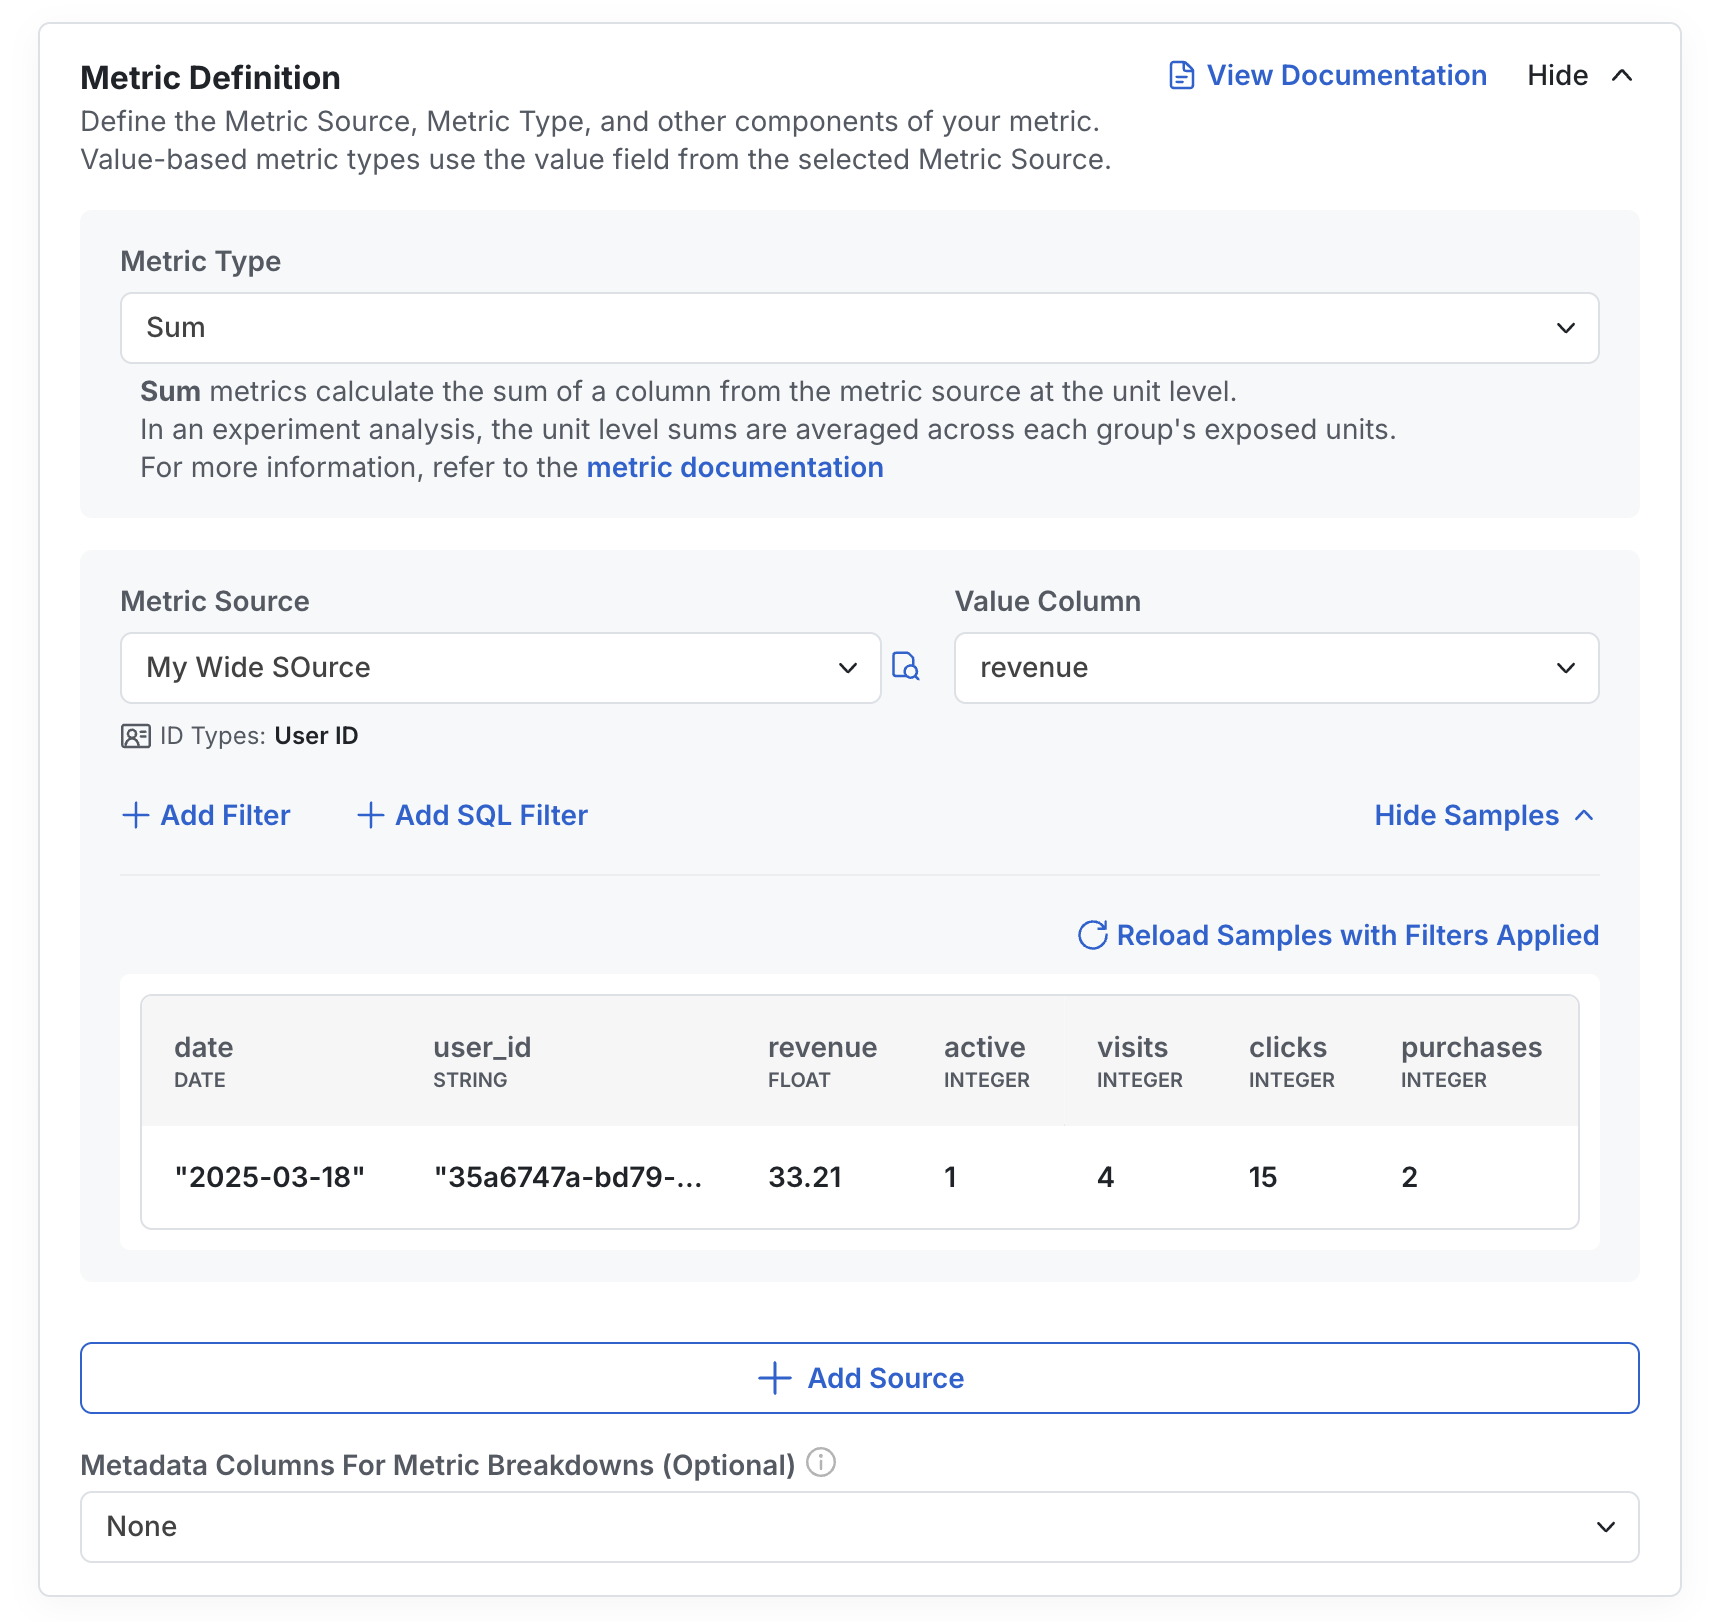
In many cases, companies will have a primary source-of-truth table about user engagement with one row per user-day and many columns representing actions taken or other values. This is very easy to integrate with Statsig. First, enter the table path and optionally a partition column to use for date partitioning: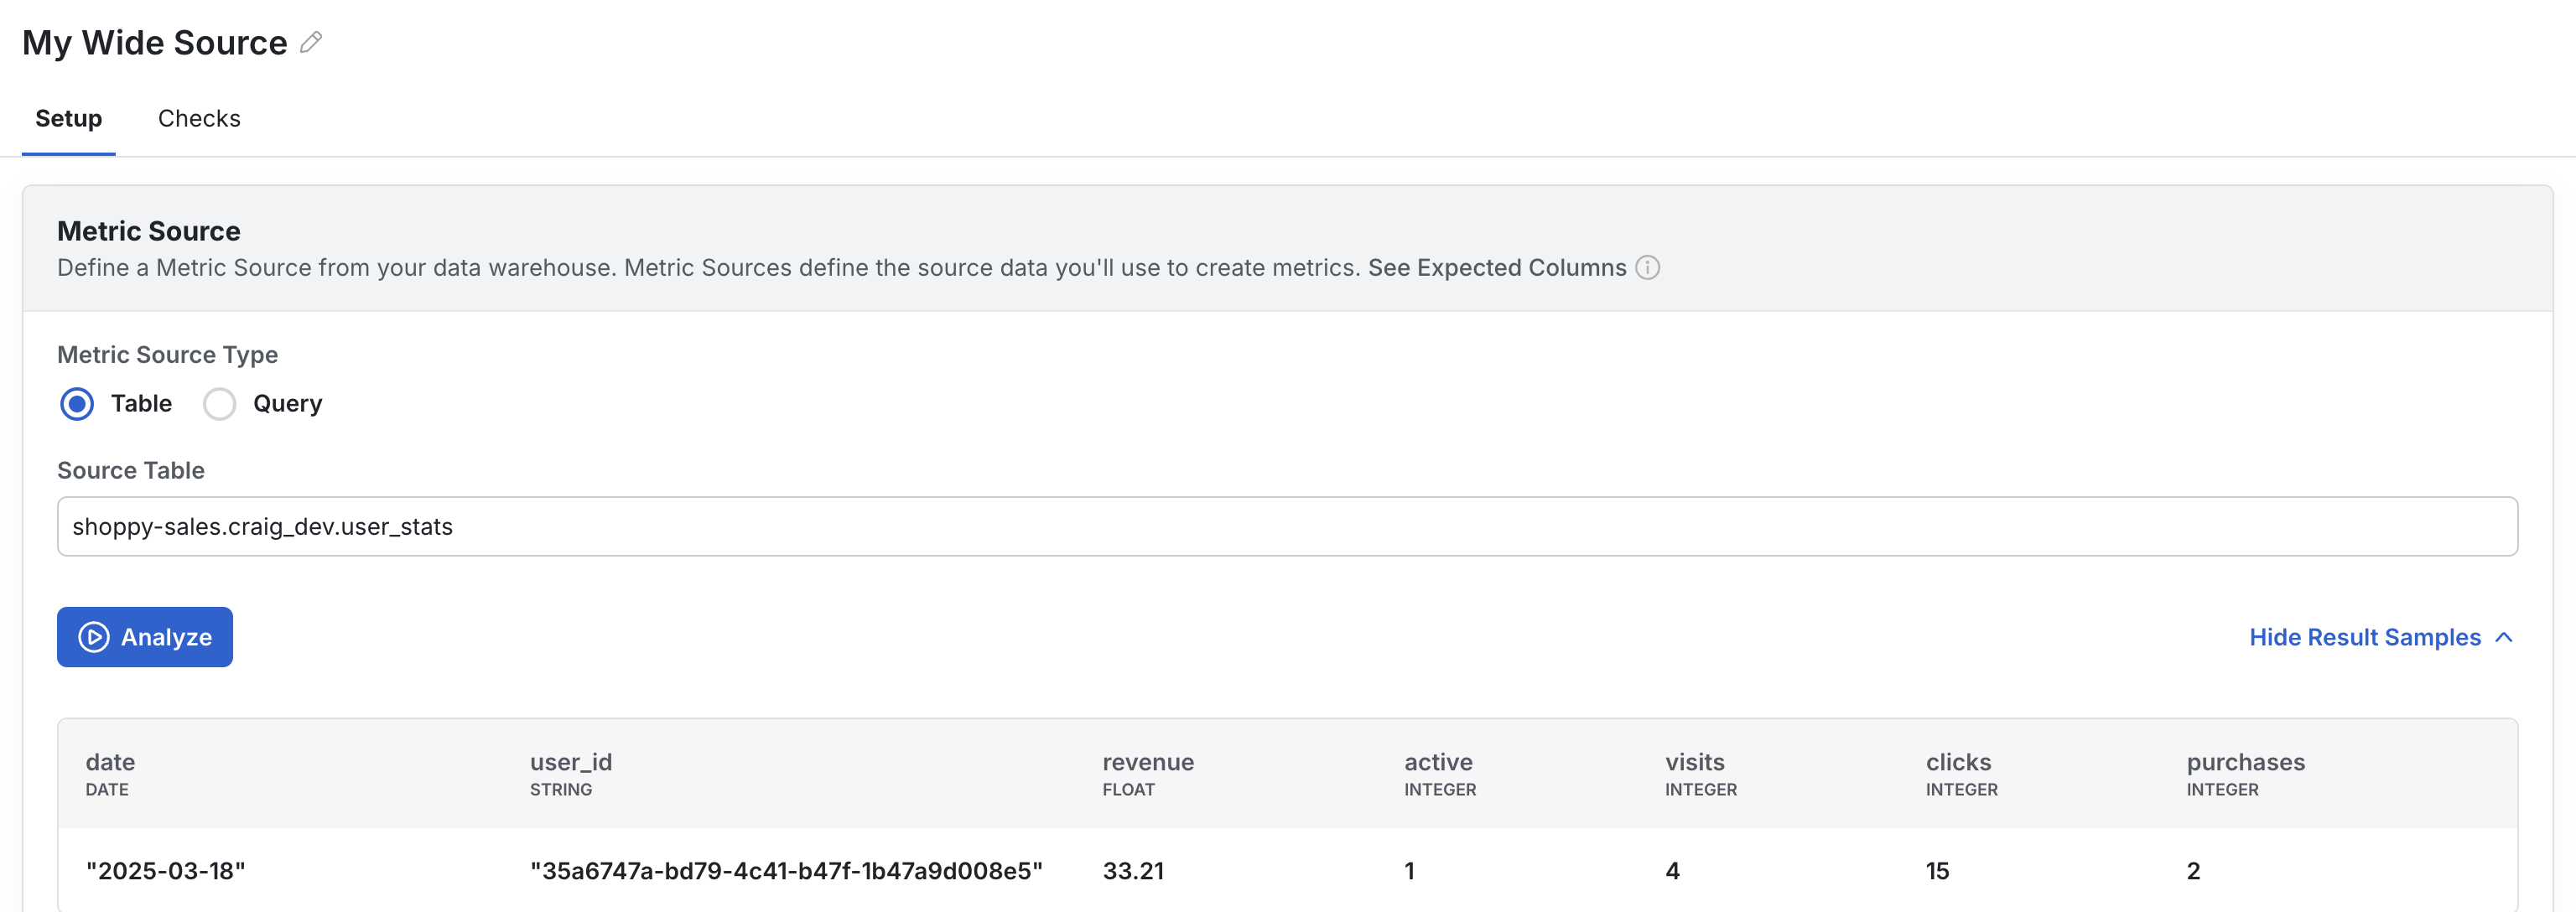
How it works in experiments
First, Statsig aggregates each unit-level record across the days they are enrolled in the experiment. Then, Statsig will calculate the mean unit-level revenue per experiment group, imputing 0s for all exposed users with no revenue. Statsig provides a description of this in-product for any user who wants to learn more:Current Account Value
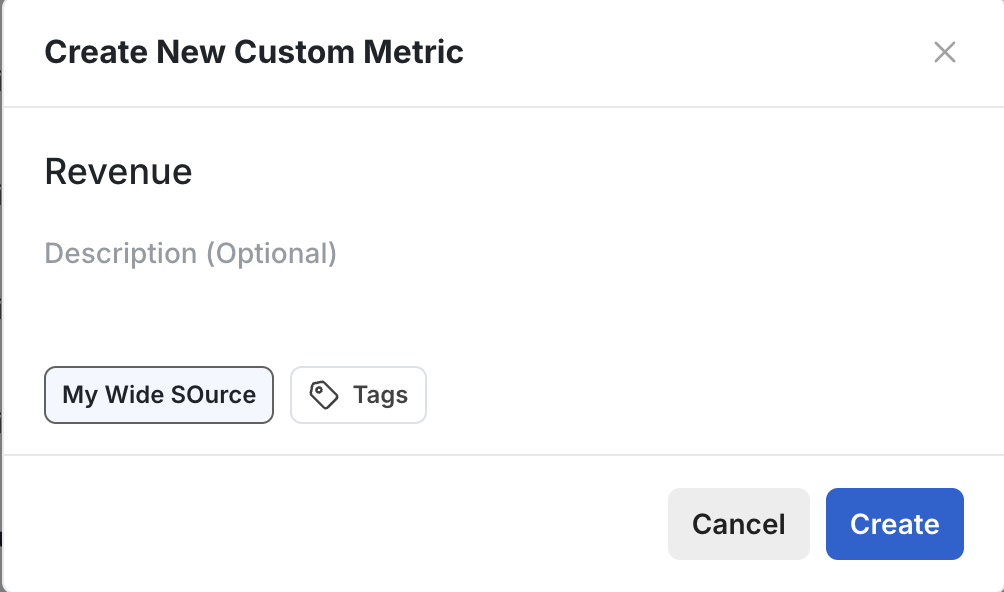
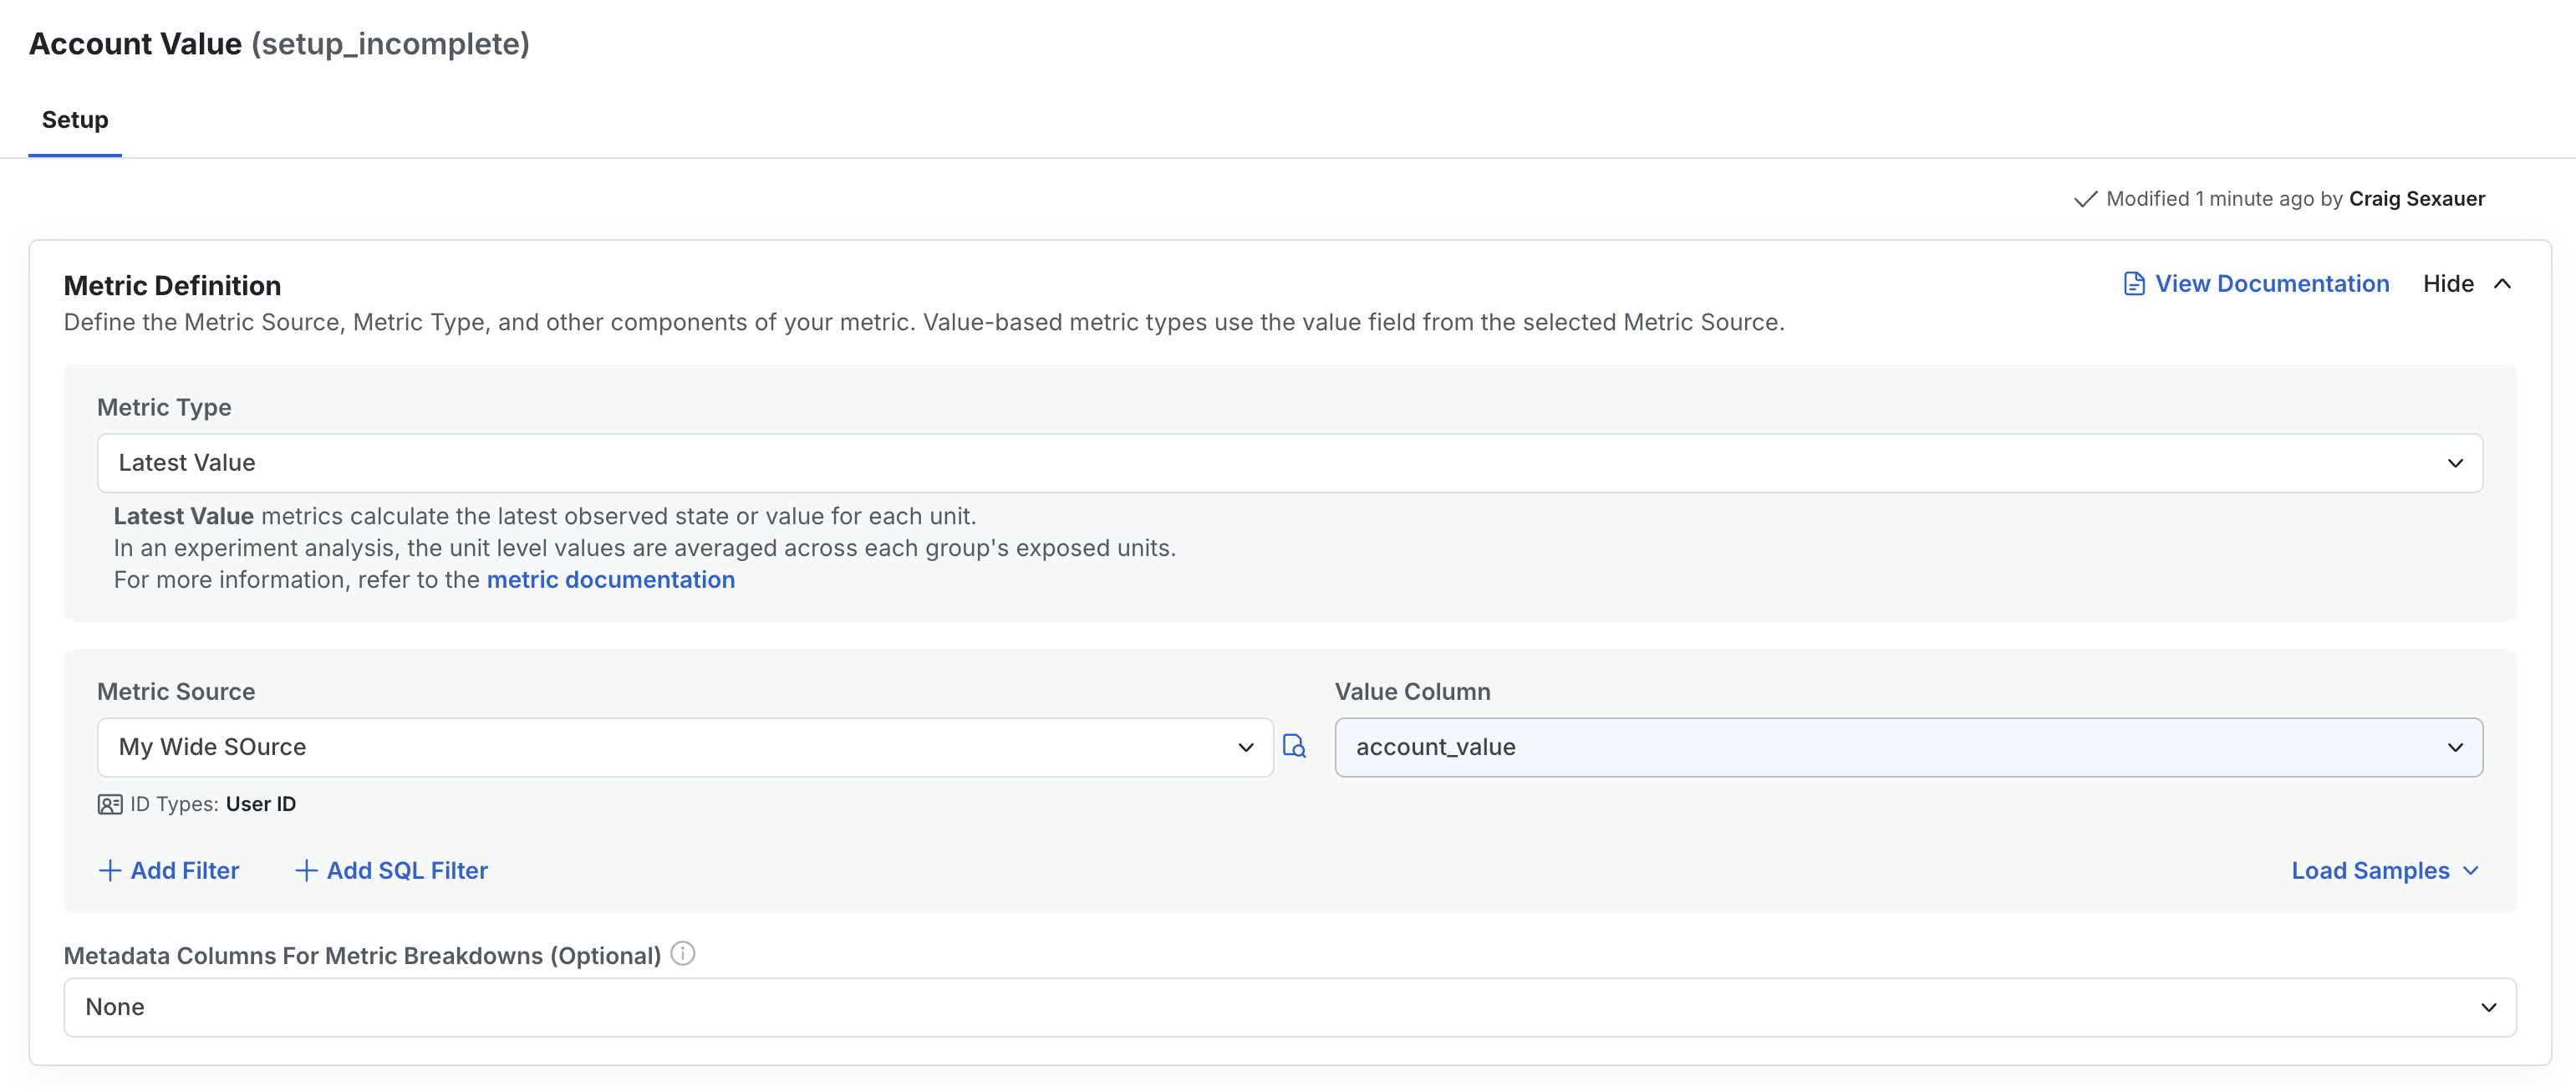
Often, you will want to understand if your experiment has altered the “state” of users. Let’s say you care about the current account value today on users in test vs. control of your experiment - have you helped users grow their account? On your end, you’ll just need a table or query that tracks users’ account values each day. Then, set up a metric source pointing to that table or query. Go to the metrics tab, press create, configure your metric name & source, and then configure a latest value metric on the column with the account value.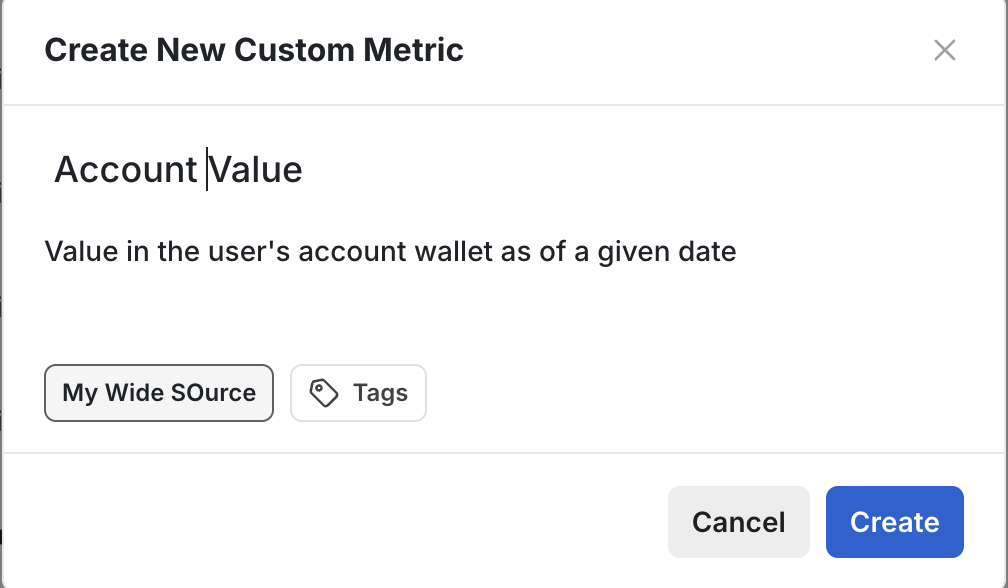
How it works in experiments
First, at unit level, Statsig calculates each day’s latest non-null value within any cohort bounds and takes the latest value from the latest day available. Then, Statsig will calculate the mean unit-level value per experiment group on each day, imputing 0s for all exposed users with no value. Statsig provides a description of this in-product for any user who wants to learn more:Users D7 Participation
A common metric in experimentation is measuring whether exposed users take specific actions within a defined time window. On your end, you will just need to provide an event table that records user action with essential columns such as user_id, timestamp and event type. Similarly as above, configure your timestamp field and ID types.- Daily Participation Rate -> it measures the days a unit was active after being exposed to the experiment divided by its total days in the experiments
- On-Time Event -> it measures if a unit performed an action any time after being exposed to the experiment
- Latest Value -> it measures if a unit passed metric filters on their last observed record
- Custom Attribution Window -> to include data for each unit in a specified time window after being exposed to the experiment